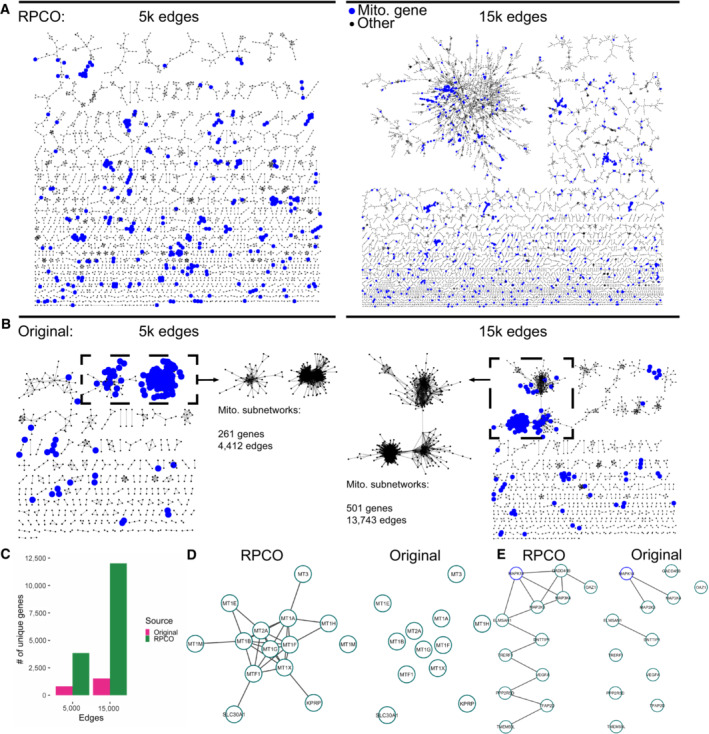
Figure 5. Network analysis of RPCO‐normalized and original DepMap data.

- Top‐ranked edges between genes from RPCO‐normalized DepMap 20Q2 data (Data ref: Broad DepMap, 2020) laid out with the yFiles organic layout algorithm in Cytoscape (Shannon et al, 2003), with mitochondrial‐associated genes highlighted in blue. (Left) The top 5,000 edges for n = 3,850 genes. (Right) The top 15,000 edges for n = 12,017 genes.
- Top‐ranked edges based on Pearson correlations between genes from original DepMap data laid out with the yFiles organic layout algorithm in Cytoscape, with mitochondrial‐associated genes highlighted in blue. The largest connected components of the networks are inset and represent many mitochondrial‐associated genes. (Left) The top 5,000 edges for n = 810 genes. (Right) The top 15,000 edges for n = 1,524 genes.
- The number of genes represented in the RPCO and original DepMap networks plotted in panels A and B.
- Cluster derived from the 15,000 edge RPCO network representing metal homeostasis genes. (Left) Edges present in 15,000 edge RPCO network. (Right) Edges present in 15,000 edge original DepMap network.
- MAPK14‐centric cluster derived from the 15,000 edge RPCO network. (Left) Edges present in 15,000 edge RPCO network. (Right) Edges present in 15,000 edge original DepMap network.
