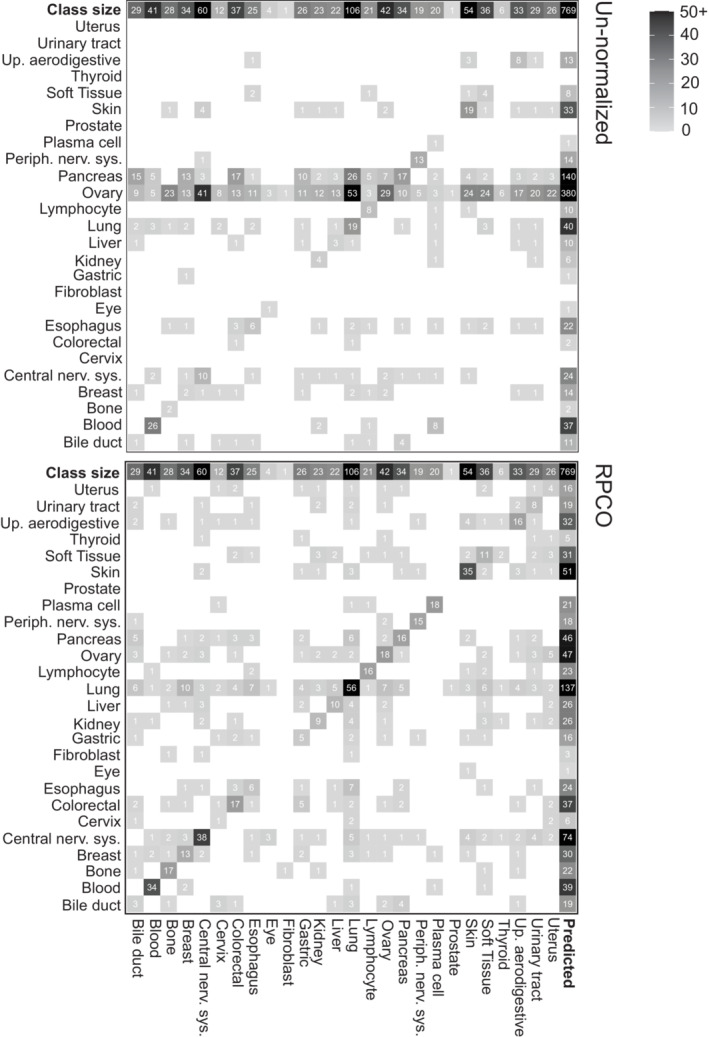
Figure EV5. Confusion matrix from K‐nearest neighbor classifier (K = 5) showing prediction results for each class (tissue lineage) of cell lines from un‐normalized and RPCO‐normalized DepMap 20Q2 (Data ref: Broad DepMap, 2020) cell line similarity networks.

X‐ and y‐axes are class labels. The top row depicts the true number of cell lines in each class, and the right‐most column is the number of predicted cell lines for each class. The diagonal represents true positives. Each row represents false positives, and each column represents false negatives sans the diagonal entry.
