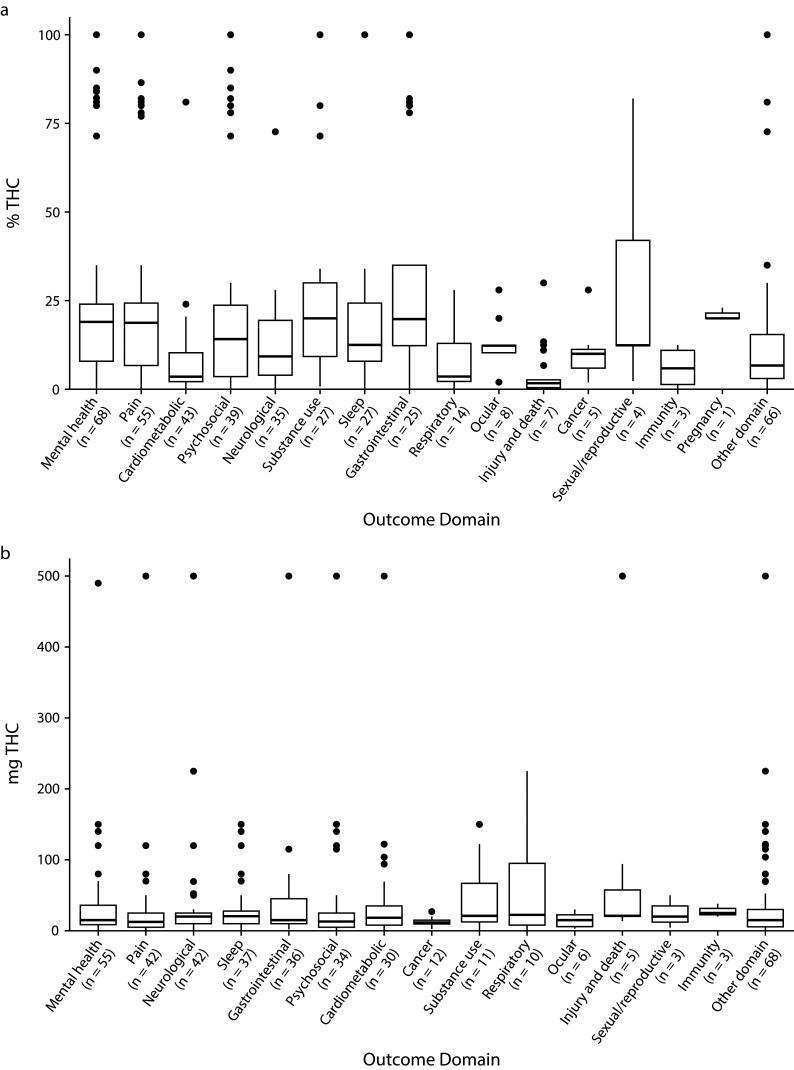
FIGURE 3—
THC Concentration Reported as Percentage of THC and Milligrams of THC by Outcome Domain in Health Effects of High-Concentration Cannabis Products: Scoping Review and Evidence Map
Note. IQR = interquartile range; THC = tetrahydrocannabinol. Boxplot of highest reported THC concentration for concentrations reported in % THC (n = 172) or mg THC (n = 113) by outcome domain. We report data on THC concentration reported as an exact concentration (e.g., 10% THC), a range (e.g., 1–10 mg THC), a threshold (e.g., < 5% THC), or some other method of aggregation (e.g., mean % THC). THC concentration values were not standardized. The midline of the box is the median THC concentration, the top and bottom of the box are first and third quartile (Q1 and Q3), whiskers represent the Q1‒1.5(IQR) and Q3 + 1.5(IQR), and points beyond the whiskers are outliers beyond this range.

