Figure 2.
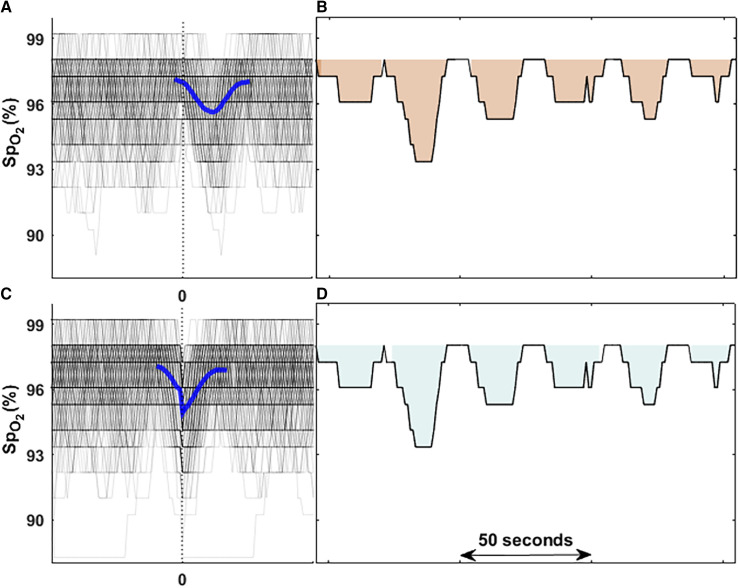
Comparison of two methods to calculate hypoxic burden (HB). (A and B) The original HB calculation based on scored respiratory events. In this method, all local oxygen saturation as measured by pulse oximetry (SpO2) curves were synchronized based on the endpoint of respiratory events (time zero; B) and then ensemble-averaged to obtain the search window for the area calculation from baseline that is the highest SpO2 value among 100 seconds before each event. (C and D) The HB calculation based on automatically detected oxygen desaturations. In this method, all local SpO2 curves were synchronized based on minimum saturation points of all identified desaturations (time zero; C) and then ensemble-averaged to obtain the search window used for area calculation of each local desaturation from baseline SpO2 value that is the start point of each local desaturation (D). The difference between the time zeros from two methods is the average lung-to-finger circulation time described previously (48).

