
Figure 1.
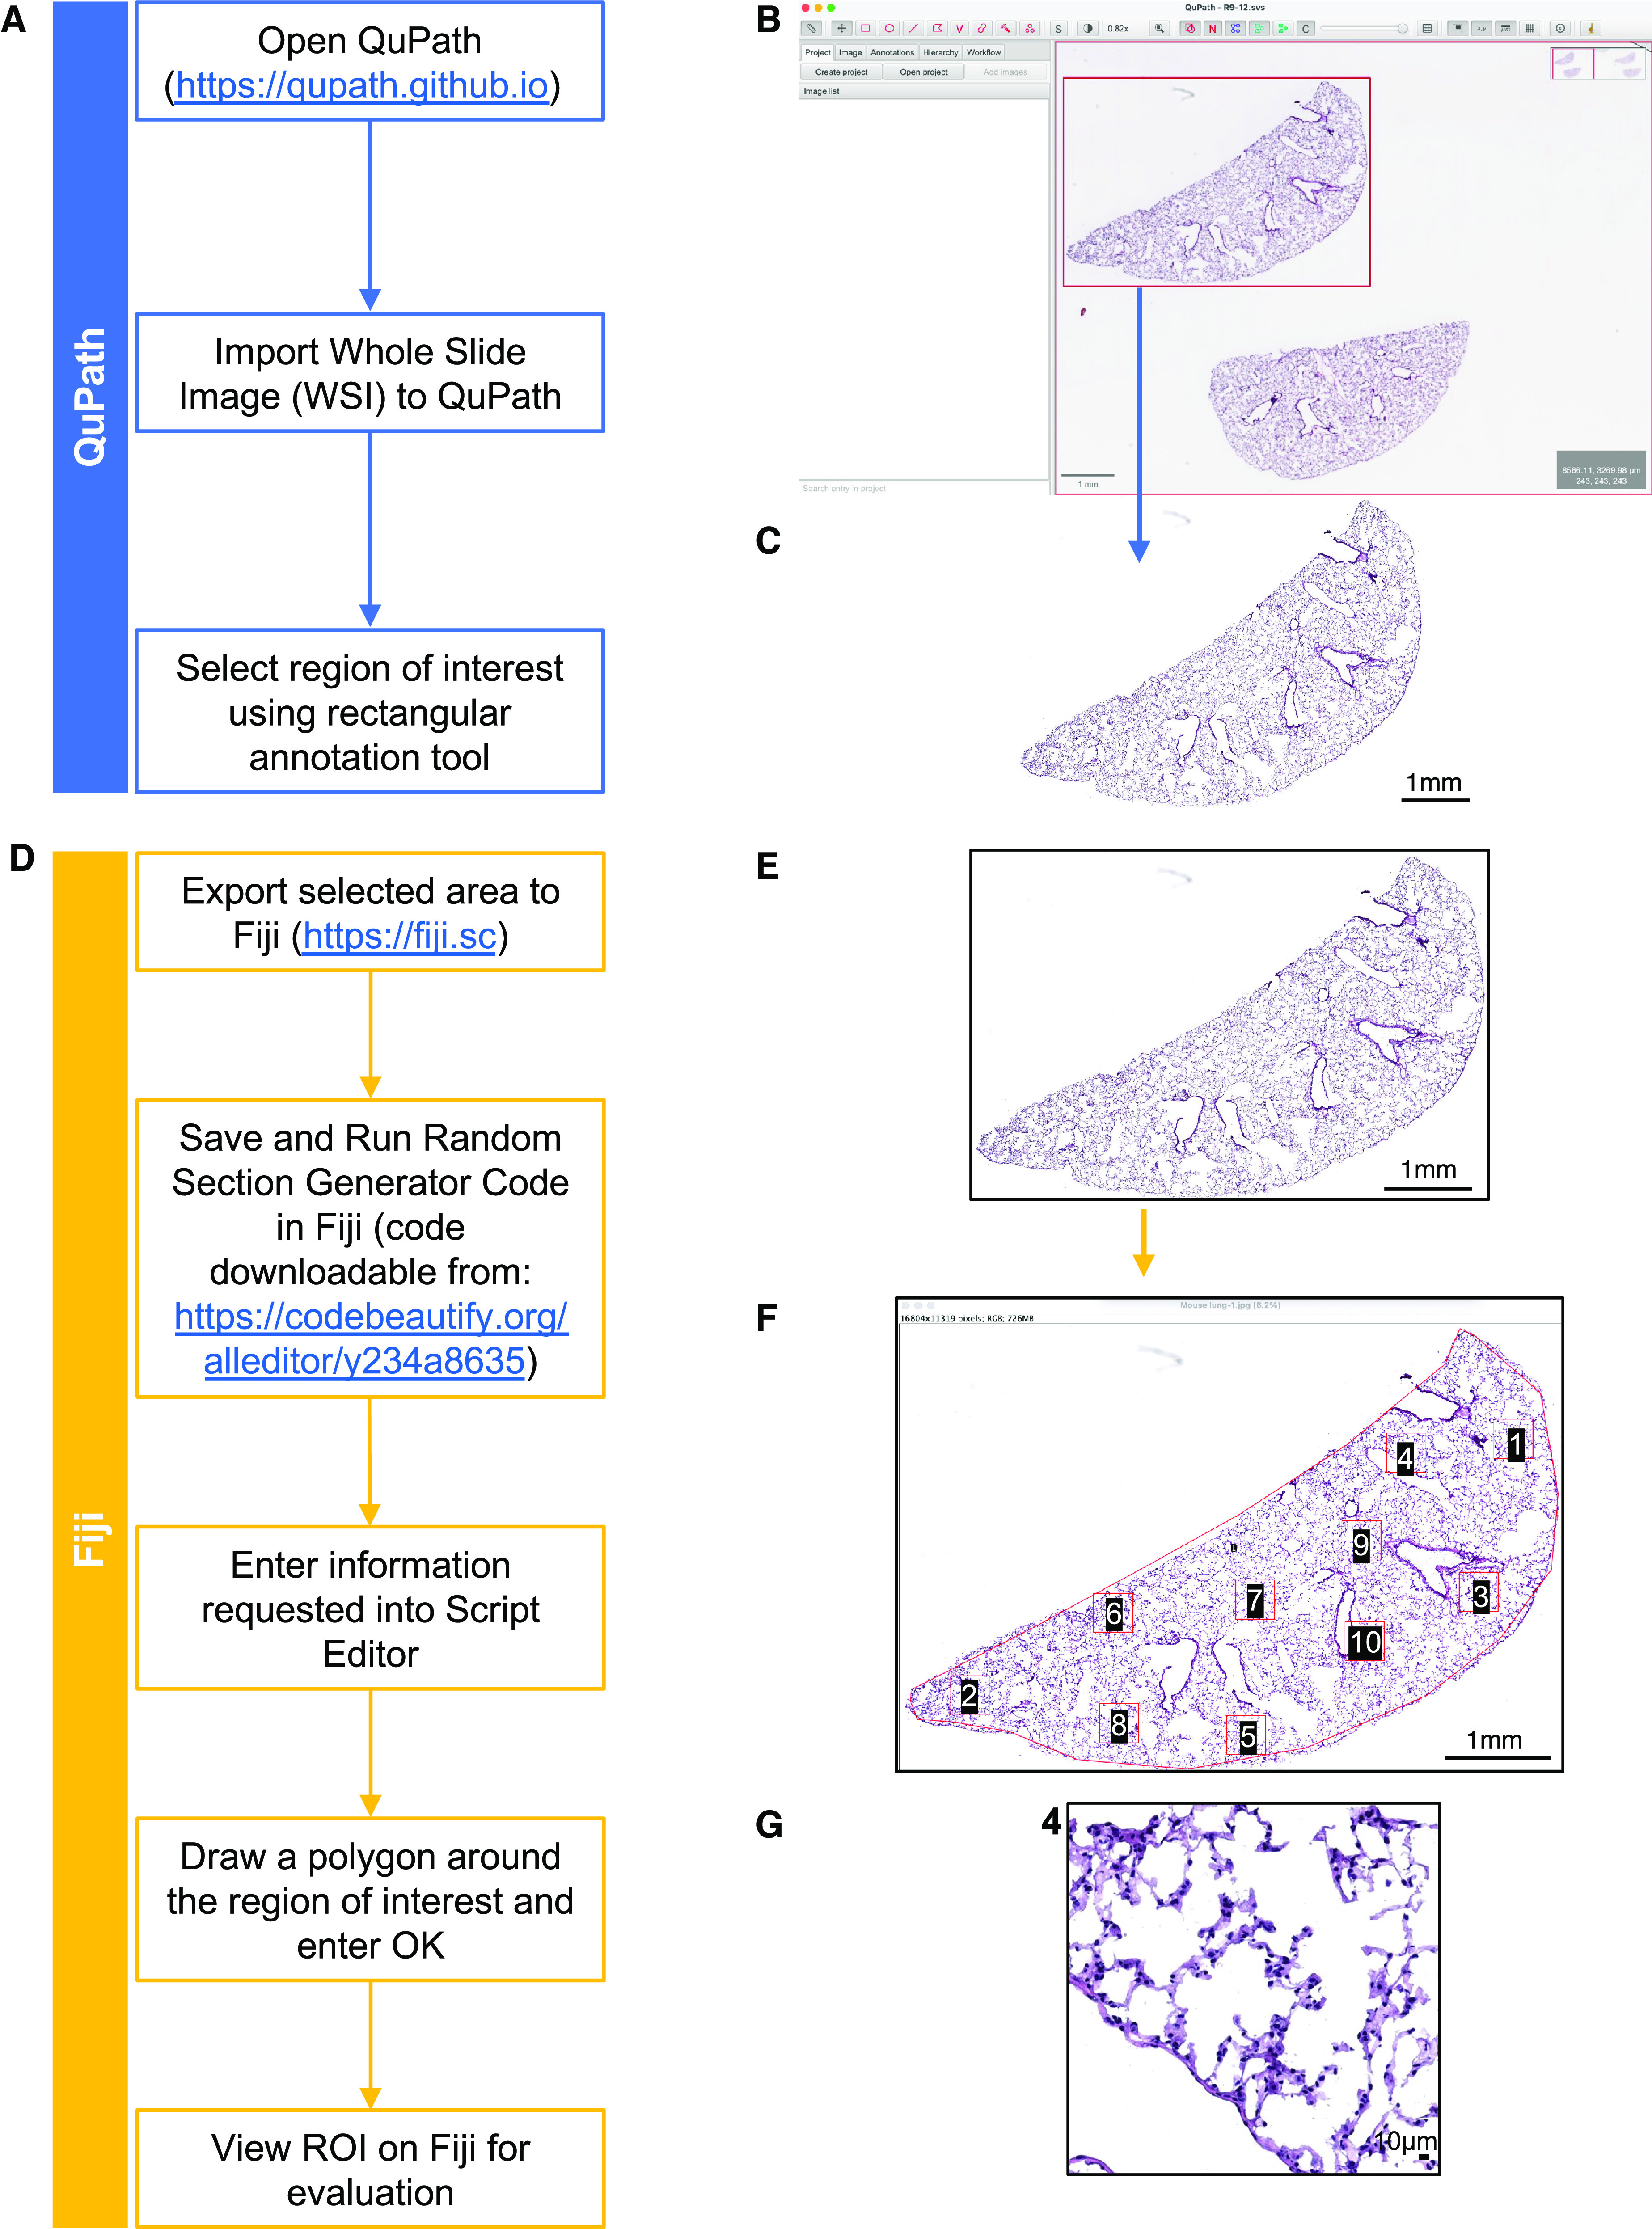
Highlights of the code applied to a mouse lung tile scan. (A–G) Left: flowchart for each step of the protocol. Right: examples of mouse lung images corresponding to each step. (A) Flowchart of QuPath steps. (B) Tile scan of whole mouse lung section opened in QuPath and selection of lung area to be exported in the red square. (C) Selected area opened in ImageJ and saved in .jpeg file format. (D) Flowchart of Fiji steps. (E) Selected area from C opened in Fiji. (F) Random regions of interest (ROIs) are selected by running the code. (G) Example of a high-magnification ROI, number 4 in this case. Scale bars: (B), (C), (E), (F), 1mm; (G), 10 μm.