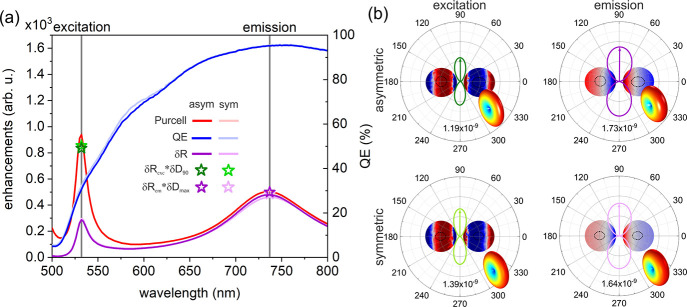
Figure 3.
Optical response of optimized Ag–SiV core–shell dimer configurations. (a) Enhancement and coupled antenna efficiency spectra. Purcell, Purcell factor; QE, quantum efficiency; and δR, radiative rate enhancement spectrum of the coupled system. The star-shaped symbols show the radiative rate enhancement multiplied by the directivity enhancement at the excitation and emission and define the excitation enhancement (green) and directional emission enhancement (violet), respectively. The darker colors correspond to the asymmetric configuration. (b) Charge distribution on the nanoantennae (blue is negative minimum, while red is positive maximum charge density) and polar angle (φ) distribution of the power density radiated into the far-field by coupled dipoles at the excitation (left) and emission (right); the lobe direction used for directivity calculation is marked with an arrow, and the maximal power density radiated into this direction is indicated at the bottom of the plot. For better visualization, the 3D radiation pattern with rotational symmetry is also shown in the insets.

