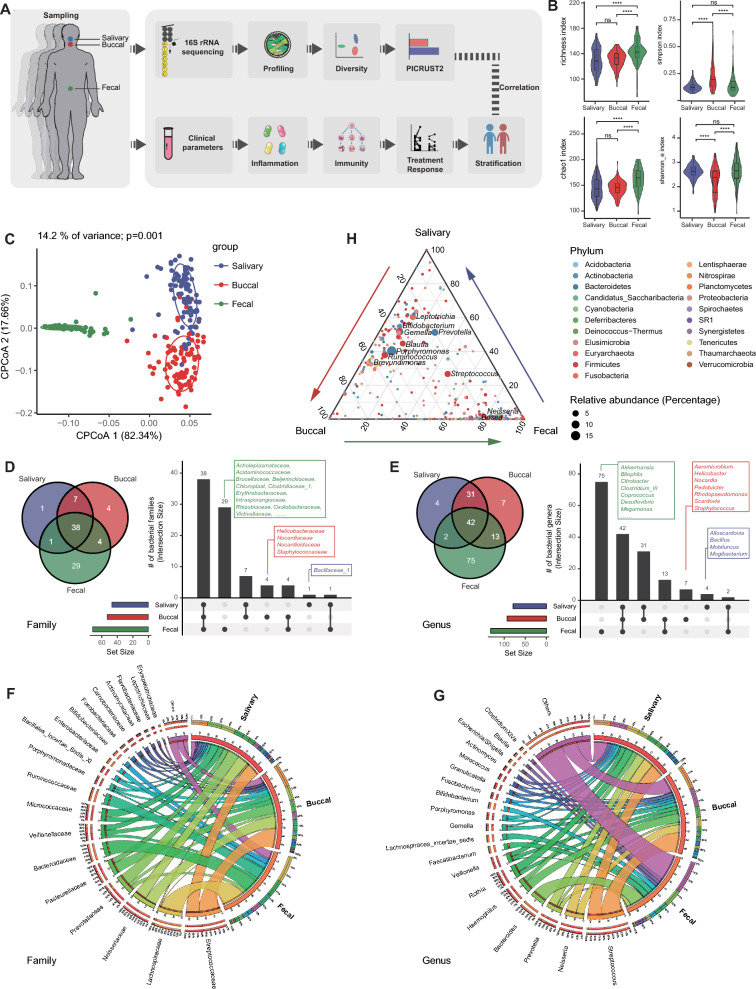
Fig. 1.
Bacterial profiles at different gastrointestinal tract niches. A Study design. Three types of samples from differed GI niches were collected in this study, including salivary, buccal, and fecal samples. B Alpha diversity indices of the microbiota, including the richness, Simpson’s, Shannon’s, and Chao1 indices. Horizontal bars within boxes represent medians. The tops and bottoms of the boxes represent the 75th and 25th percentiles, respectively. The upper and lower whiskers cover 1.5 × the interquartile range from the upper and lower edges of the box, respectively. P-values were obtained using the one-way ANOVA test (comparisons among four groups). C The constrained principal coordinate analysis based on the Bray–Curtis distance. The R software (v 4.0.1) with the vegan (v 2.5–7) package were used and P-values were obtained using permutational multivariate analysis of variance (PERMANOVA). D and E The upset plot shows the bacterial family (D) and genus (E) count in each GI niche. F and G Relative abundance of the top 20 bacterial families (F) and genera (G). Visualization was performed using Circos (http://circos.ca/). The right circle in the outer part shows the groups and relative proportions of bacterial species. The left outer ring and inner bands indicate the relative proportions (%) of bacterial genera in the different groups. The left inner circle represents the relative abundances of all bacteria. H The ternary plot shows the distribution of the specific bacterial genus in each GI niche. The point color represents the phylum classification of the bacterial genus. The point size presents the mean percentage of a specific genus

