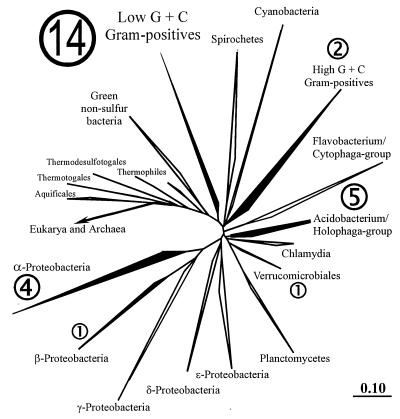
FIG. 2.
Phylogenetic tree of almost 8,000 SSU rRNA sequences within the ARB database. The clusters containing the DA sequences are highlighted. The numbers indicate the distribution of the DA sequences as compiled in Fig. 1. The alpha Proteobacteria and Cyanobacteria clusters also represent mitochondrial and chloroplast sequences, respectively. The Archaea and Eucarya branches are hidden. The bar in the lower right corner indicates the branch length and represents 0.1 base substitution per nucleotide.

