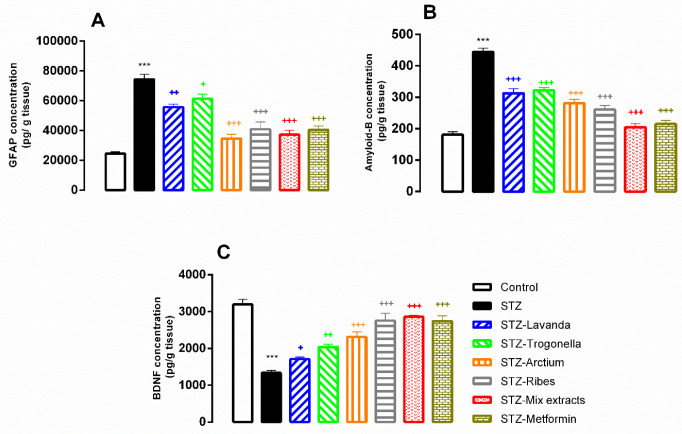
Figure 6.
Comparative analysis of GFAP (A), amyloid-B (B), and BDNF (C) parameters in hippocampal tissues
Data presented as mean±standard error of the mean (SEM). n = 10. ***P<0.001 vs control group, +P<0.05, ++P<0.01, and +++P<0.001 vs STZ group
Eth: ethanol, MDA: malondialdehyde, SOD: superoxide dismutase, STZ: streptozocin

