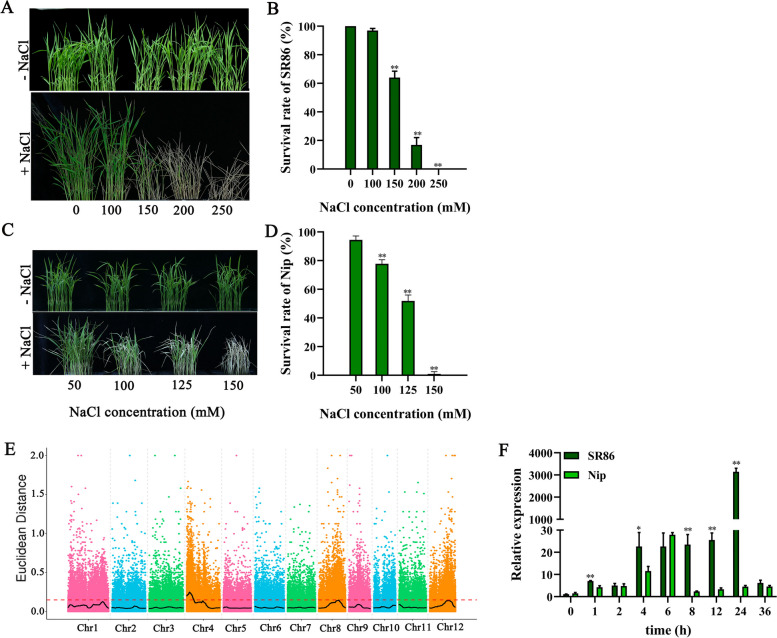
Fig. 1.
Phenotypic and QTL analysis of SR86 and Nip plants under NaCl stress. A Phenotype of SR86 seedling grown under different salt concentrations (0–250 mM). B The survival rate of SR86 plants. C Phenotype of Nip rice grown under different salt concentrations (50–150 mM). D The survival rate of Nip plants. E Distribution map of SNP-index values of the mixed pool of F2 plants. The SNP-index or ΔSNP-index value is calculated via each point in the figure. The black line indicates the fitted SNP-index or ΔSNP-index values, and the red dashed line is the 99th percentile threshold. F Temporal expression pattern of LOC_Os04g03320 in SR86 and Nip plants under NaCl stress. In (B, D, F), data present mean ± standard deviation of three biological replicates. Asterisks indicate statistically significant differences (*P < 0.05, **P < 0.01; Student’s t-test)

