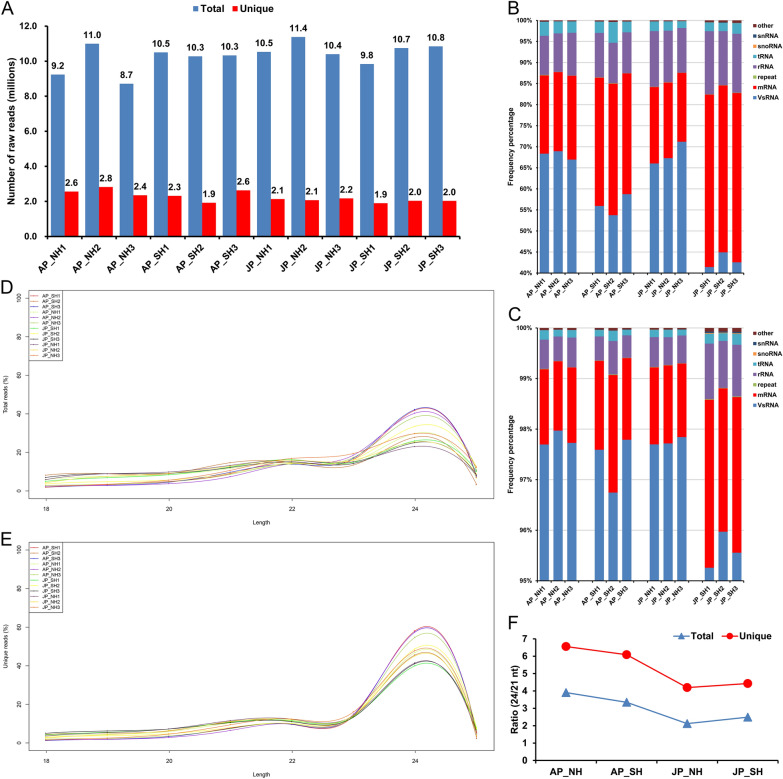
Fig. 2.
Overview of small RNA sequencing data and length distribution. A Statistics of total and unique sRNA reads in 12 sequencing libraries. B, C) Annotation distribution of the total B and unique C reads in each sample. other, other Rfam RNA; snRNA, small nuclear RNA; snoRNA, small nucleolar RNA; tRNA, transfer RNA; rRNA, ribosomal RNA; repeat, repeat associate RNA; mRNA, messenger RNA; VsRNA, valid small RNA. D, E Length distribution of 18–25 nt small RNAs identified in total (D) and unique € reads. The X-axis indicates sRNAs of different lengths, while the Y-axis represents the percentage of sRNAs at a certain length. F Ratio of 24/21 nt sRNAs. The ratio of NH and SH at the JJ spot is significantly lower than that of AY. Three biological replicates are merged into the mean value. AY, Anyang; JJ, Jiujiang. AP_NH, NH under mild HT stress; AP_SH, SH under mild HT stress; JP_NH, NH under extreme HT stress; JP_SH, SH under extreme HT stress

