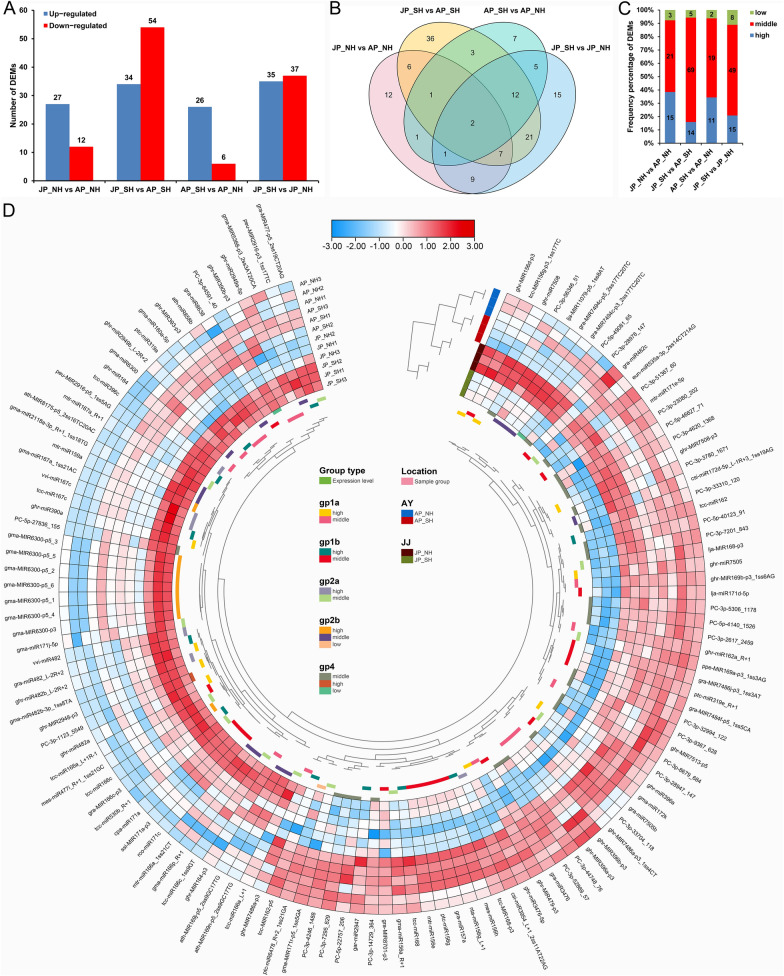
Fig. 4.
Identification of differentially expressed miRNAs in NH and SH under mild and extreme HT stress. A Number of DEMs that were up- or down-regulated under mild and extreme HT stress. B Venn diagram showing the number of unique and shared DEMs. C Frequency percentage of DEMs with different expression levels. D Hierarchical cluster analysis of the identified 126 DEMs using a bending heat map drawn by TBtools software. The relative expression levels in the figure are the normalized expression data displayed with log10 (norm + 1) value. AP_NH, NH under mild HT stress; AP_SH, SH under mild HT stress; JP_NH, NH under extreme HT stress; JP_SH, SH under extreme HT stress

