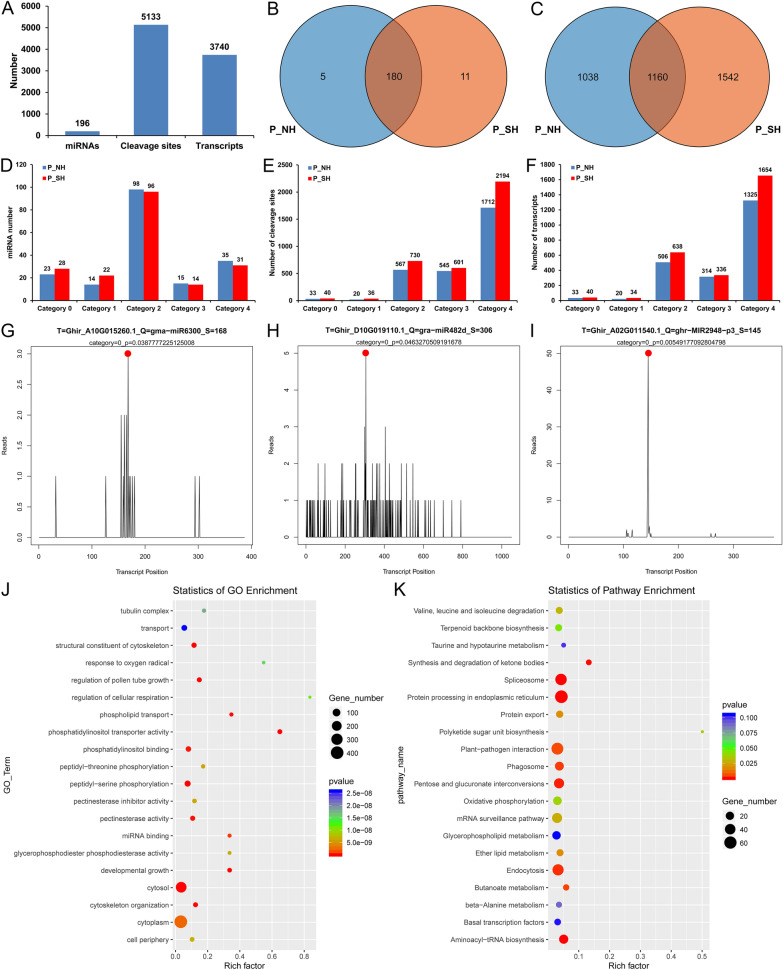
Fig. 7.
Target identification of miRNAs by degradome sequencing and GO and KEGG enrichment. A Number of miRNAs and their target genes. B, C Venn diagrams showing the number of unique and shared miRNAs B and their target genes C in P_NH and P_SH. D–F Categories and statistics of miRNAs (D), cleavage sites (E), and involving transcripts (F). G Target plot (T-plot) showing that gma-miR6300 cleaves the Ghir_A10G015260.1 transcript at the 168th nucleotide position. H T-plot showing that gra-miR482d cleaves the Ghir_D10G019110.1 transcript at the 306th nucleotide position. I T-plot showing that ghr-MIR2948-p3 cleaves the Ghir_A02G011540.1 transcript at the 145th nucleotide position. J, K GO (J) and KEGG (K) enrichment analysis of the miRNA targets. P_NH, NH under HT stress; P_SH, SH under HT stress

