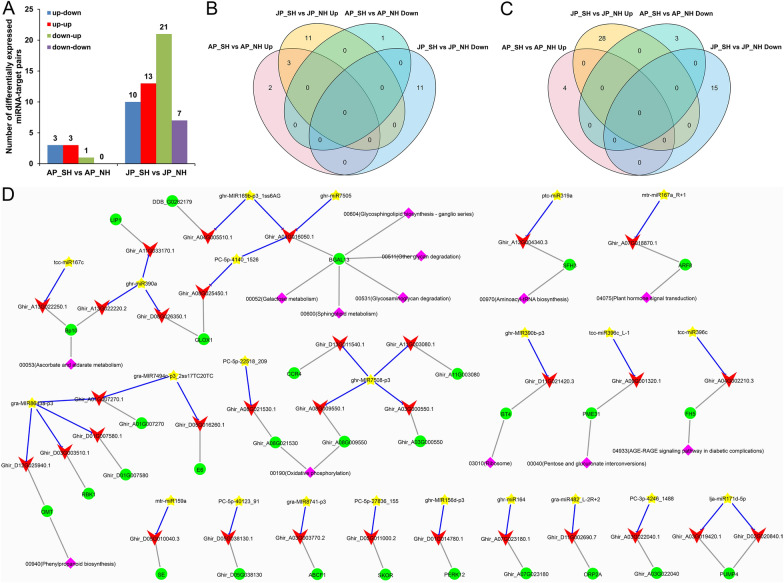
Fig. 8.
The regulatory miRNA–mRNA interaction pairs in response to HT stress. A Number of four representative regulatory types of miRNA–mRNA interaction pairs. B, C Venn diagrams showing the number of unique and shared miRNAs (B) and their target transcripts (C) in SH compared with NH under HT. D Representative miRNA–mRNA–gene-KEGG regulatory network. Undirected gray lines represent relational pairs, and blue blunt-ended lines represent the inhibitory effect of the miRNAs on the corresponding targets. Yellow star, miRNAs; red vee, target transcripts; green circle, target genes; and purple diamond, KEGG pathways. AP_NH, NH under mild HT stress; AP_SH, SH under mild HT stress; JP_NH, NH under extreme HT stress; JP_SH, SH under extreme HT stress

