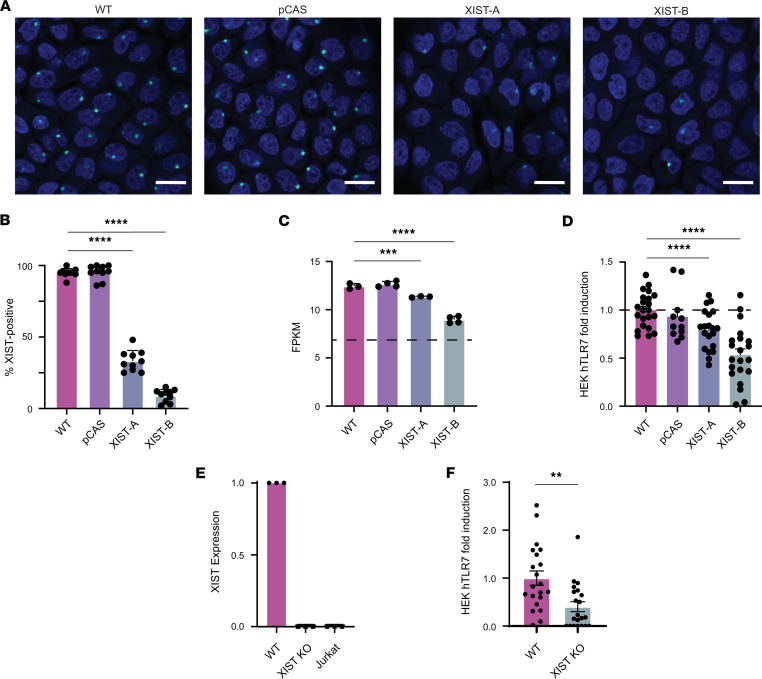
Figure 3. XIST knockdown diminishes TLR7-activating potential of whole cellular RNA.
(A) A431 cells were targeted with CRISPR/Cas9 technology to generate XIST-depleted XIST-A and XIST-B cell populations. Representative RNAScope images showing XIST expression (green) and nuclei (blue) in WT, pCAS, XIST-A, and XIST-B cultures. Scale bar indicates 20 μm. (B) Percentage of XIST-positive cells was determined by masked quantification of 10 randomly chosen RNAScope image fields per cell population. (C) Bar graph showing XIST expression in terms of fragments per kilobase of exon per million mapped fragments (FPKM) in each cell population as measured by RNA sequencing. The dotted line at y = 7 shows the lower limit of detection in our RNA-sequencing experiment. (D) Colorimetric assay measuring SEAP secretion by HEK-hTLR7 cells transfected with fragmented cellular RNA from WT, pCAS, XIST-A, or XIST-B cells. Results shown are pooled from 3 independent experiments. (E) Bar graph showing XIST expression in WT, XIST-KO, and Jurkat cells as measured by qPCR. XIST expression calculated using the ΔΔCt method using GAPDH as an internal control and the WT cell line as the reference. (F) Colorimetric assay measuring SEAP secretion by HEK-hTLR7 cells transfected with fragmented cellular RNA from either WT or XIST-KO A431 cells. (B–F) All conditions compared with WT by multiple comparisons within 1-way ANOVA with multiple-comparison correction. ** indicates P < 0.01, *** indicates P < 0.001, and **** indicates P < 0.0001. (F) Conditions compared by unpaired t test. (B–F) Error bars represent 1 SD.

