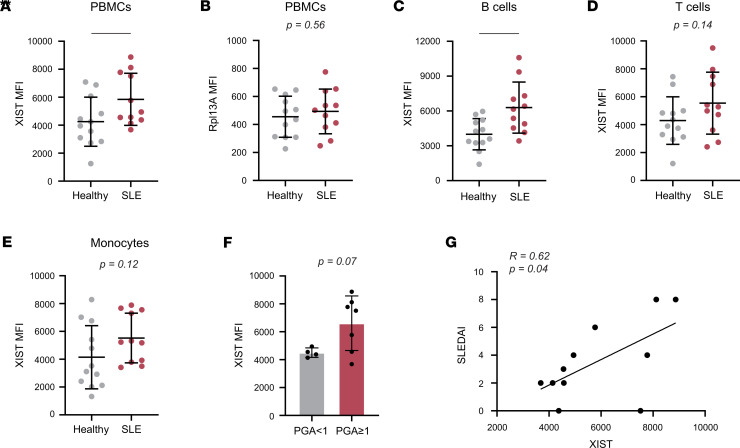
Figure 4. XIST expression in PBMCs correlates with SLE status and disease activity.
RNA flow cytometry was used to measure XIST and Rpl13A expression levels in PBMCs from women with SLE (n = 11) versus healthy women (n = 12). (A and B) Dot plots showing XIST (A) and RPL13A (B) MFI in SLE and control PBMCs. Healthy controls are also shown in Supplemental Figure 3C. (C–E) XIST MFI in B cells (C), T cells (D), and monocytes (E) from patients with SLE and controls. (F) Bar graph showing XIST MFI in SLE patients with a PGA ≥ 1 (n = 7) and a PGA < 1 (n = 4). (G) Scatterplot of XIST MFI versus SLEDAI. Pearson’s correlation coefficient and P value for linear regression shown. (A–E) * indicates P < 0.05, and ** indicates P < 0.01. Error bars indicate 1 standard deviation. (A–F) Expression of XIST or RPL13A compared between patients with SLE and healthy donors (A–E) or disease groups (F) by t test. (G) Correlation tested by simple linear regression.

