Figure 1.

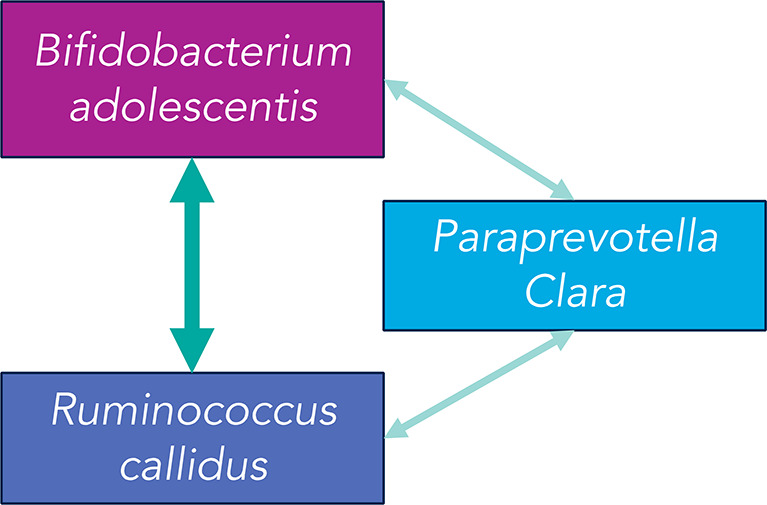
Visual representation of the bacterial taxa in the microbial cliques identified using Microbiome Co-occurrence Analysis (MiCA). The width of the arrows represents the relative frequency of occurrence of the corresponding 2-taxa clique.

Visual representation of the bacterial taxa in the microbial cliques identified using Microbiome Co-occurrence Analysis (MiCA). The width of the arrows represents the relative frequency of occurrence of the corresponding 2-taxa clique.