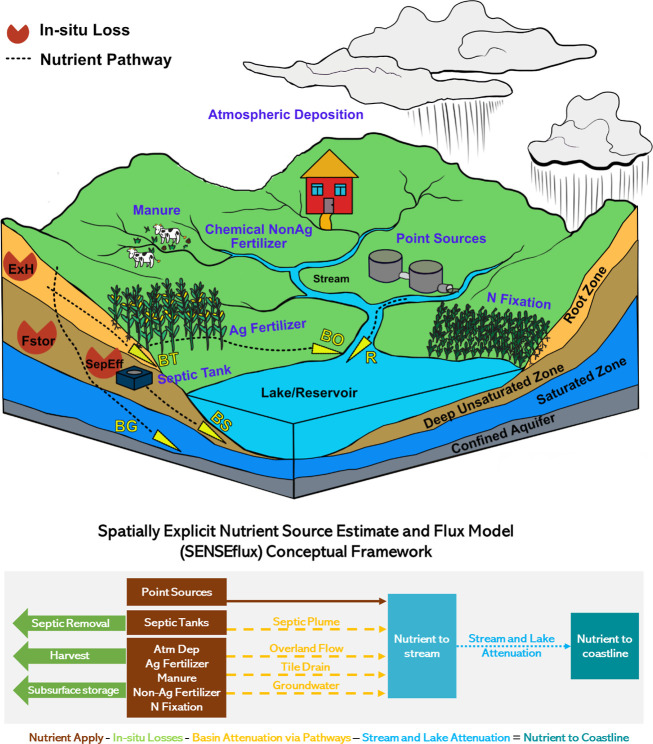
Figure 1.
Schematic diagram (above) and conceptual framework (below) of the SENSEflux model. In the schematic diagram, seven nutrient sources are indicated in the blue text. Nutrient transport across the landscape via surface and groundwater pathways is indicated with black dashed lines and yellow triangles. Basin attenuation terms: BO: overland flow, BT: tile field, BG: groundwater flow, BS: septic plume. River attenuation term: R: in-stream and lake attenuation. In the conceptual diagram, brown boxes represent nutrient sources, and green arrows pointing left are septic onsite removal, crop harvest, and loss in the deep unsaturated zone. Dashed yellow arrows indicate distinct nutrient transport pathways.

