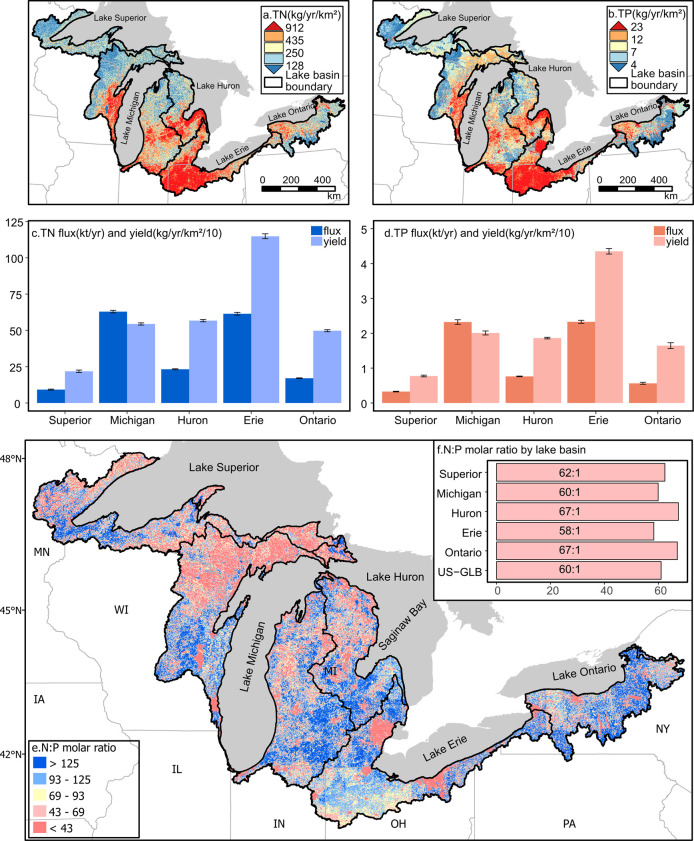
Figure 3.
Predicted nutrient delivery as yield (kg/km2/yr) to the Great Lakes shoreline and summarized nutrient loads by lake basin (black outlines) within the US-GLB. TN (a) and TP (b) yields are direct outputs from SENSEflux that are resampled to 720 m resolution for display purposes and classified in quantiles within which each color represents ∼20% of the US-GLB area. Bars in [(c)—TN] and [(d)—TP] represent the total basin-accumulated fluxes and yields (area normalized) for each nutrient from the best performing parameter set within the local optimization, and error bars represent standard deviation from the unique best-performing global optimization runs. Map of N/P yield molar ratio at 720 m resolution across US-GLB, rounded to the nearest 1 (e); bar chart of mean N/P load molar ratio by lake basin within US-GLB (f).

