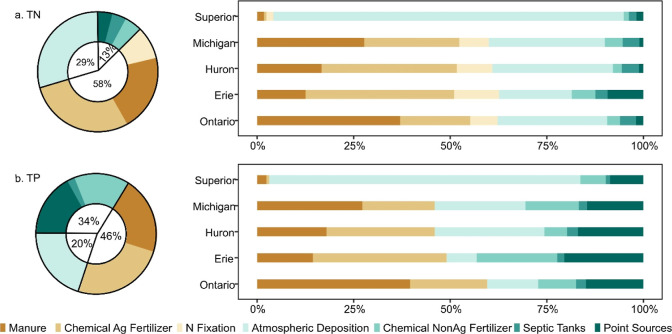
Figure 5.
Estimated percent of nutrients delivered to lakes by source. Donut figures represent the US-GLB while rotated stacked bar plots show each lake basin within the US-GLB. The black donut circle was divided into agricultural sources (brownish), urban sources (greenish), and atmospheric deposition sources (light green) with corresponding percentages.

