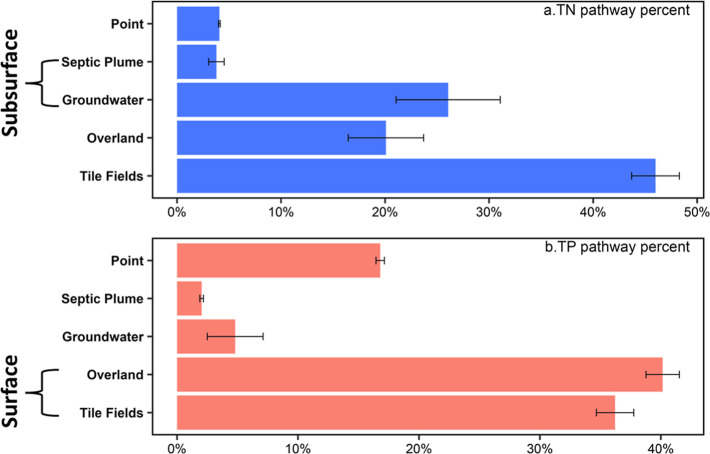
Figure 6.
Estimated percentages of total nutrients delivered to the Great Lakes through each pathway (surface: overland and tile fields; subsurface: groundwater and septic plume). Colored bars indicate the best-performing local optimization outcome, and error bars represent parameter uncertainty given by the standard deviation from the best-performing global optimization runs.

