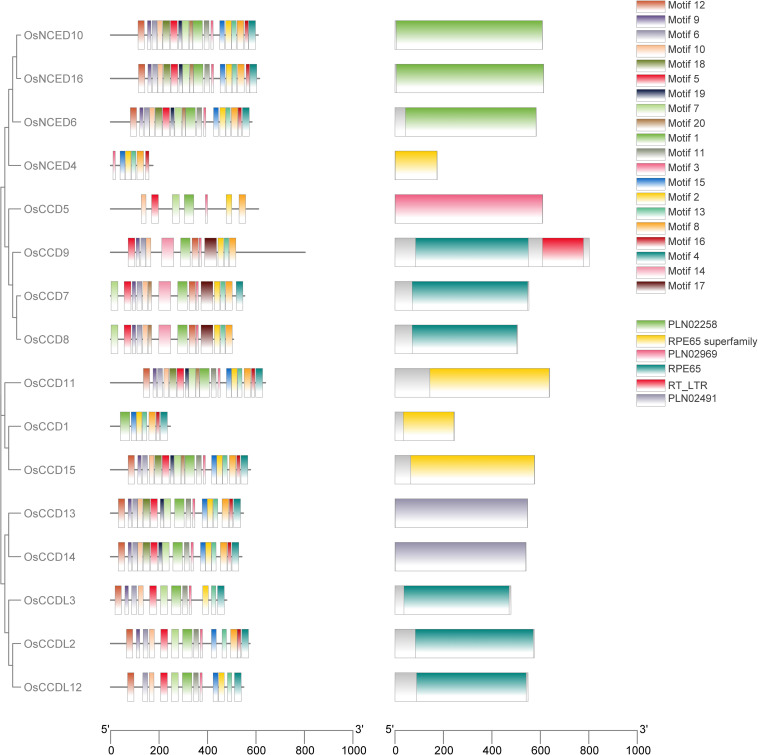
Figure 3.
A bar graph with color-coded bars was generated to depict the motif distribution analysis of rice OsCCO proteins using MEME version 5.5.2. The analysis identified a total of 20 distinct motifs. To better understand the relationship between the OsCCO proteins and motif distribution, the graph was connected to a phylogenetic tree, providing additional insights into the evolutionary patterns and functional relationships among the OsCCO proteins.

