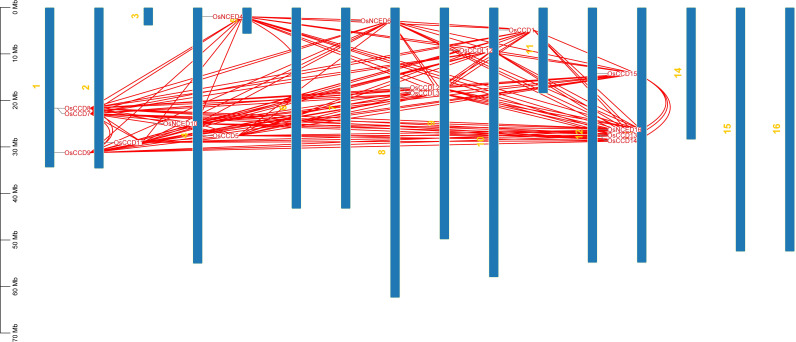
Figure 6.
The chromosomal distribution of the OsCCO gene family in rice is illustrated in the figure. The figure’s blue bars represent rice’s individual chromosomes, while the red lines indicate the functional relationships or co-regulation between OsCCO genes. This analysis provides insights into the spatial arrangement and potential interactions among OsCCO genes within the rice genome.

