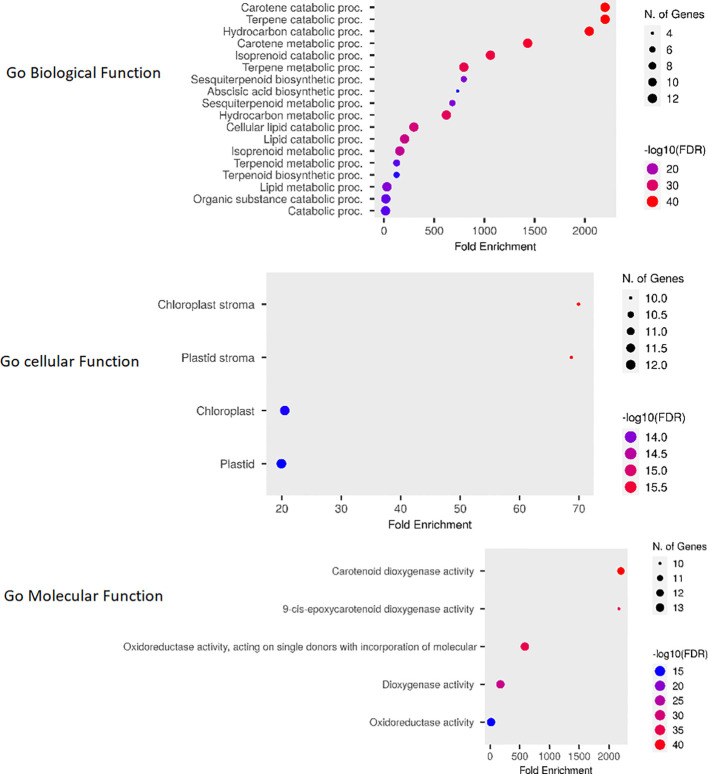
Figure 9.
The Fold Enrichment chart visually represents the overlapping functions of OsCCO genes. The chart uses dot plots, where red dots indicate a higher number of genes associated with a particular process, while smaller blue dots represent a lower number of genes. This chart provides a quick overview of the functional distribution among OsCCO genes and highlights the processes in which they are predominantly involved.

