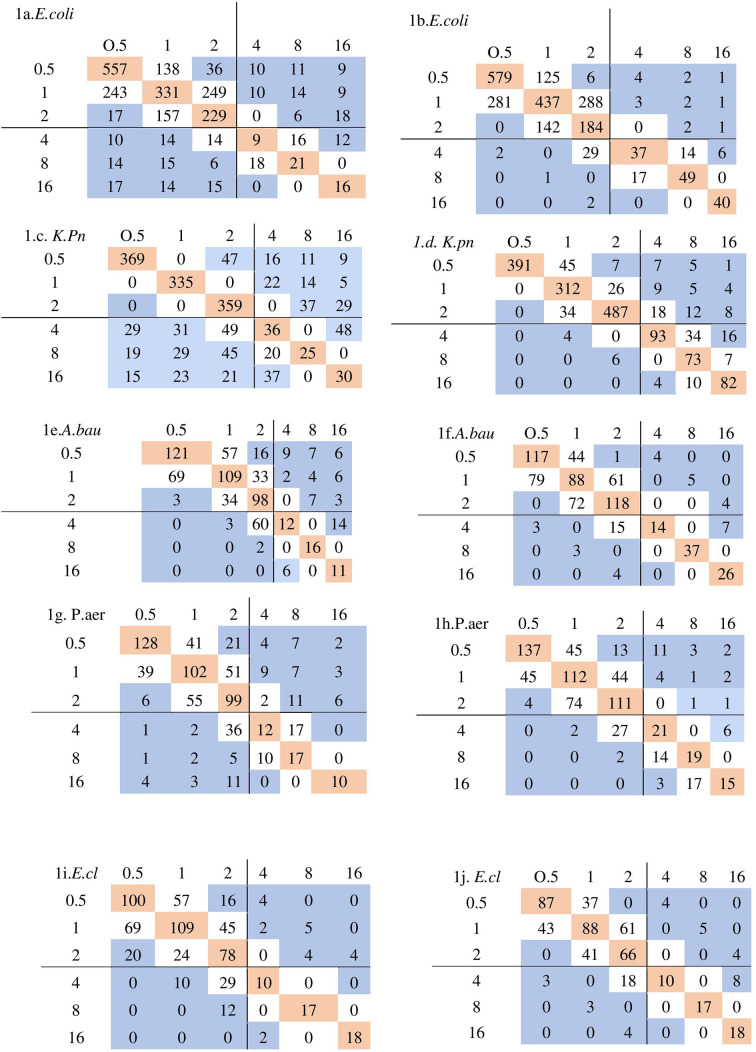
Fig. 1.
Scatter diagram obtained by plotting MIC obtained by reference BMD method (x-axis) with MIC by test method i.e. Vitek two/CBDE (y-axis). Bold lines represent the breakpoint MICs in micrograms per millilitre. The pink colour boxes are the isolates showing perfect agreement. The essential agreement is highlighted by both pink and white colour boxes. 1 a. MIC of BMD vs Vitek2 for E. coli (Escherichia coli), 1 b. MIC of BMD vs CBDE for E. coli 1 c. MIC of BMD vs Vitek2 for K.pn (Klebsiella pneumoniae), 1 d. MIC of BMD vs CBDE for K.pn 1e. MIC of BMD vs Vitek2 for A.bau (Acinetobacter baumanii), 1 f. MIC of BMD vs CBDE for A.bau 1 g. MIC of BMD vs Vitek2 for P.aer (Pseudomonas aeruginosa),1h. MIC of BMD vs CBDE for P.aer 1i. MIC of BMD vs Vitek2 for E.cl (Enterobacter cloacae), 1 j. MIC of BMD vs CBDE for E.cl.

