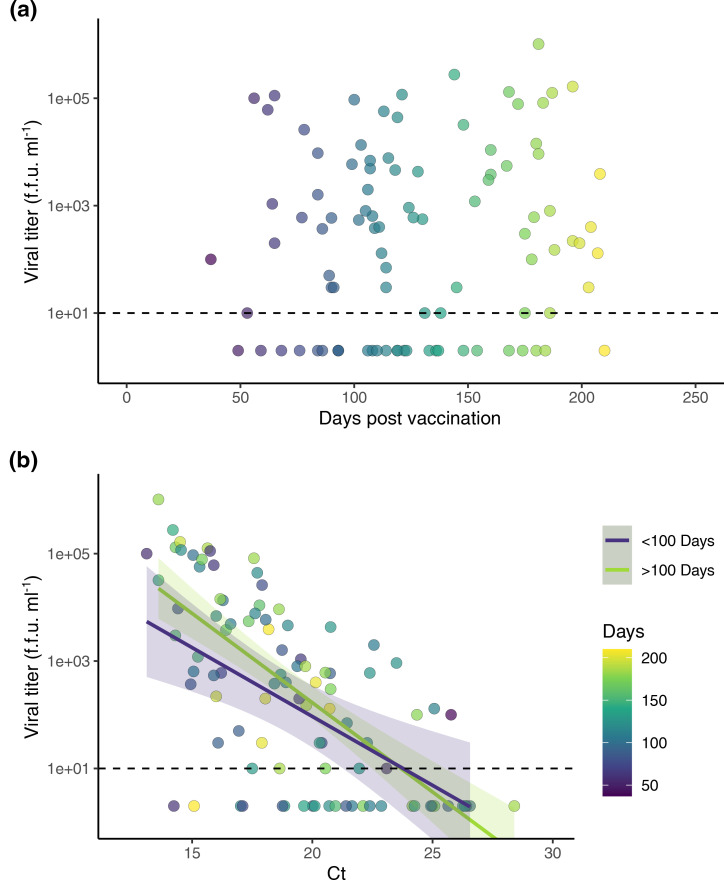
Fig. 2.
Infectious viral titres and CT values as a function of time since vaccination. Clinical specimens from vaccinated individuals (N = 97) infected with SARS-CoV-2 Delta variant were used to visualize the relationship between viral titer, viral RNA (CT), and time since full vaccination. (a) Days since fully vaccinated (≥14 days since completion of a primary COVID-19 vaccine series) on the x axis plotted against viral titer (f.f.u. ml–1) on the y axis. (b) Viral RNA (CT) on the x axis plotted against viral titre (f.f.u. ml–1) on the y axis. Data point fill color corresponds with days post vaccination. Samples were grouped by <100 days (purple) or >100 days (green) post vaccination, and separate linear regression lines (ŷ = β0 + β1x̄ + Ɛ) were fit to each group. Shading indicates confidence interval (0.95) for each line. (a, b) Dashed line indicates the limit of detection for infectious titer (10 f.f.u. ml–1). f.f.u. stands for focus forming unit.

