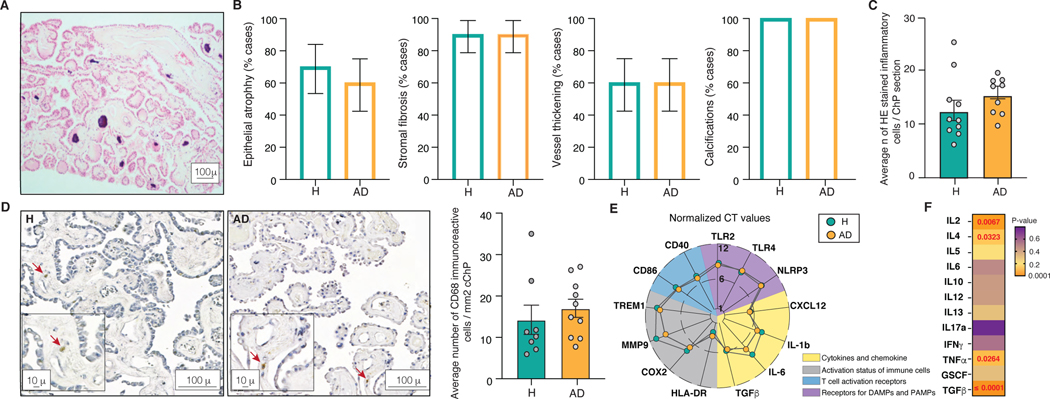
Figure 3. Structure and the inflammatory status of the ChP in AD.
(A) Representative H&E stained FFPE section of the ChP.
(B) Percentage of healthy individuals and AD patients showing epithelial atrophy, stromal fibrosis, vessel thickening and calcifications in the ChP. 1 technical replicate ± s.e.m.; two-sample t-test (p≤0.05).
(C) Average number of inflammatory cells in H&E stained ChP from healthy individuals and AD patients. Mean number of cells per 6 high-power microscopy fields per section ± s.e.m.; two-sample t-test (p≤0.05).
(D) Anti-CD68 antibody labelled cells in the ChP of healthy individuals and AD patients. Mean number of cells per 10 high-power microscopy fields per section ± s.e.m.; two-sample t-test (p≤0.05).
(E) Expression levels of markers of the activation of the ChP immune cells in healthy individuals and AD. The lines crossing central, middle and outermost circle represent distances corresponding to normalized CT values of 1, 6 and 12, respectively.
(F) ELISArray measured ChP cytokine levels in healthy individuals and AD. Mean of 3 technical replicates per sample ± s.e.m.; two-sample t-test (p≤0.05).

