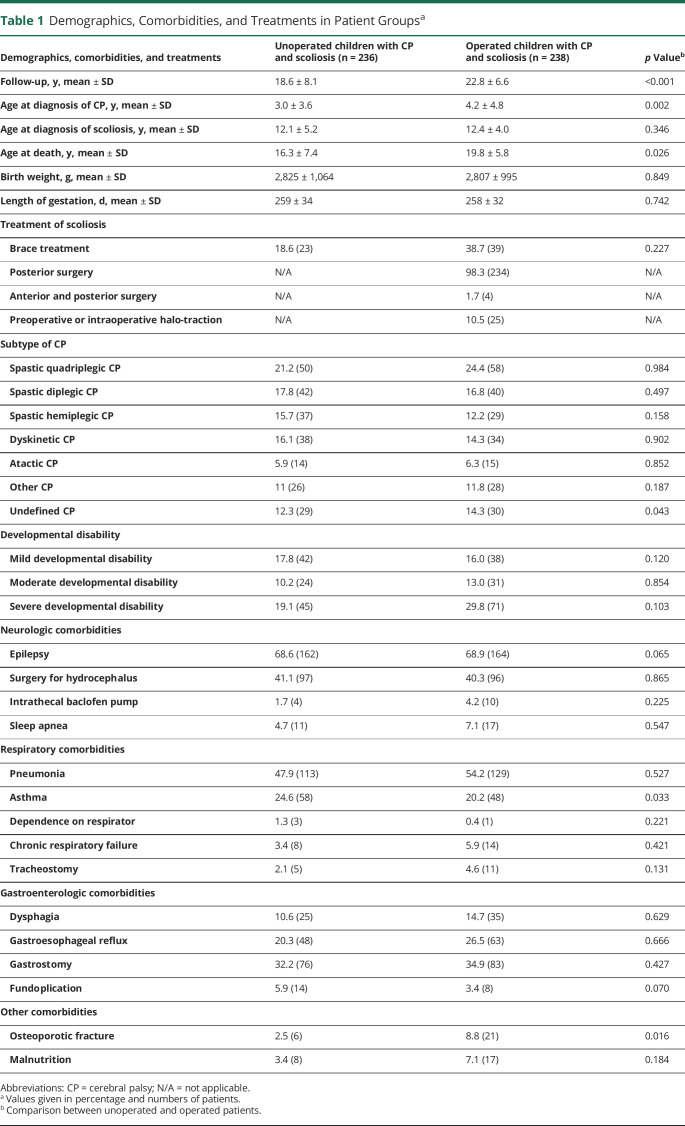
Table 1.
Demographics, Comorbidities, and Treatments in Patient Groupsa
| Demographics, comorbidities, and treatments | Unoperated children with CP and scoliosis (n = 236) | Operated children with CP and scoliosis (n = 238) | p Valueb |
| Follow-up, y, mean ± SD | 18.6 ± 8.1 | 22.8 ± 6.6 | <0.001 |
| Age at diagnosis of CP, y, mean ± SD | 3.0 ± 3.6 | 4.2 ± 4.8 | 0.002 |
| Age at diagnosis of scoliosis, y, mean ± SD | 12.1 ± 5.2 | 12.4 ± 4.0 | 0.346 |
| Age at death, y, mean ± SD | 16.3 ± 7.4 | 19.8 ± 5.8 | 0.026 |
| Birth weight, g, mean ± SD | 2,825 ± 1,064 | 2,807 ± 995 | 0.849 |
| Length of gestation, d, mean ± SD | 259 ± 34 | 258 ± 32 | 0.742 |
| Treatment of scoliosis | |||
| Brace treatment | 18.6 (23) | 38.7 (39) | 0.227 |
| Posterior surgery | N/A | 98.3 (234) | N/A |
| Anterior and posterior surgery | N/A | 1.7 (4) | N/A |
| Preoperative or intraoperative halo-traction | N/A | 10.5 (25) | N/A |
| Subtype of CP | |||
| Spastic quadriplegic CP | 21.2 (50) | 24.4 (58) | 0.984 |
| Spastic diplegic CP | 17.8 (42) | 16.8 (40) | 0.497 |
| Spastic hemiplegic CP | 15.7 (37) | 12.2 (29) | 0.158 |
| Dyskinetic CP | 16.1 (38) | 14.3 (34) | 0.902 |
| Atactic CP | 5.9 (14) | 6.3 (15) | 0.852 |
| Other CP | 11 (26) | 11.8 (28) | 0.187 |
| Undefined CP | 12.3 (29) | 14.3 (30) | 0.043 |
| Developmental disability | |||
| Mild developmental disability | 17.8 (42) | 16.0 (38) | 0.120 |
| Moderate developmental disability | 10.2 (24) | 13.0 (31) | 0.854 |
| Severe developmental disability | 19.1 (45) | 29.8 (71) | 0.103 |
| Neurologic comorbidities | |||
| Epilepsy | 68.6 (162) | 68.9 (164) | 0.065 |
| Surgery for hydrocephalus | 41.1 (97) | 40.3 (96) | 0.865 |
| Intrathecal baclofen pump | 1.7 (4) | 4.2 (10) | 0.225 |
| Sleep apnea | 4.7 (11) | 7.1 (17) | 0.547 |
| Respiratory comorbidities | |||
| Pneumonia | 47.9 (113) | 54.2 (129) | 0.527 |
| Asthma | 24.6 (58) | 20.2 (48) | 0.033 |
| Dependence on respirator | 1.3 (3) | 0.4 (1) | 0.221 |
| Chronic respiratory failure | 3.4 (8) | 5.9 (14) | 0.421 |
| Tracheostomy | 2.1 (5) | 4.6 (11) | 0.131 |
| Gastroenterologic comorbidities | |||
| Dysphagia | 10.6 (25) | 14.7 (35) | 0.629 |
| Gastroesophageal reflux | 20.3 (48) | 26.5 (63) | 0.666 |
| Gastrostomy | 32.2 (76) | 34.9 (83) | 0.427 |
| Fundoplication | 5.9 (14) | 3.4 (8) | 0.070 |
| Other comorbidities | |||
| Osteoporotic fracture | 2.5 (6) | 8.8 (21) | 0.016 |
| Malnutrition | 3.4 (8) | 7.1 (17) | 0.184 |
Abbreviations: CP = cerebral palsy; N/A = not applicable.
Values given in percentage and numbers of patients.
Comparison between unoperated and operated patients.

