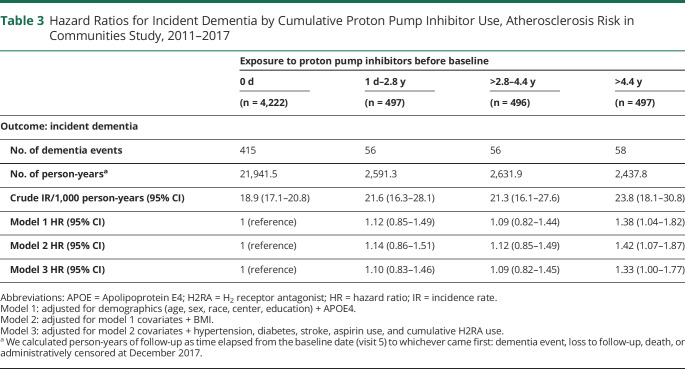
Table 3.
Hazard Ratios for Incident Dementia by Cumulative Proton Pump Inhibitor Use, Atherosclerosis Risk in Communities Study, 2011–2017
| Exposure to proton pump inhibitors before baseline | ||||
| 0 d | 1 d–2.8 y | >2.8–4.4 y | >4.4 y | |
| (n = 4,222) | (n = 497) | (n = 496) | (n = 497) | |
| Outcome: incident dementia | ||||
| No. of dementia events | 415 | 56 | 56 | 58 |
| No. of person-yearsa | 21,941.5 | 2,591.3 | 2,631.9 | 2,437.8 |
| Crude IR/1,000 person-years (95% CI) | 18.9 (17.1–20.8) | 21.6 (16.3–28.1) | 21.3 (16.1–27.6) | 23.8 (18.1–30.8) |
| Model 1 HR (95% CI) | 1 (reference) | 1.12 (0.85–1.49) | 1.09 (0.82–1.44) | 1.38 (1.04–1.82) |
| Model 2 HR (95% CI) | 1 (reference) | 1.14 (0.86–1.51) | 1.12 (0.85–1.49) | 1.42 (1.07–1.87) |
| Model 3 HR (95% CI) | 1 (reference) | 1.10 (0.83–1.46) | 1.09 (0.82–1.45) | 1.33 (1.00–1.77) |
Abbreviations: APOE = Apolipoprotein E4; H2RA = H2 receptor antagonist; HR = hazard ratio; IR = incidence rate.
Model 1: adjusted for demographics (age, sex, race, center, education) + APOE4.
Model 2: adjusted for model 1 covariates + BMI.
Model 3: adjusted for model 2 covariates + hypertension, diabetes, stroke, aspirin use, and cumulative H2RA use.
We calculated person-years of follow-up as time elapsed from the baseline date (visit 5) to whichever came first: dementia event, loss to follow-up, death, or administratively censored at December 2017.

