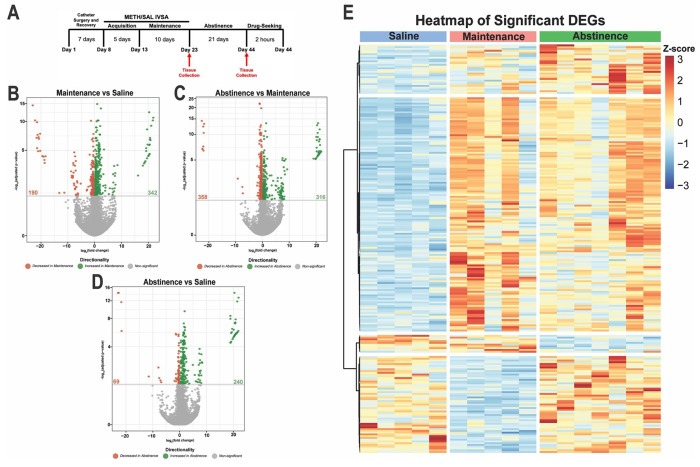
Figure 2. METH self-administration induces distinct transcriptional profiles in dorsal striatal microglia.
A) Experimental timeline. Volcano plots showing significant DE genes (Log2FC vs −log10 adjusted p-value) in B) Maintenance vs Saline, C) Abstinence vs Maintenance, and D) Abstinence vs Saline. Red (decreased) and green (increased) circles represent DE genes that reached significance based on adjusted p-value < .05. E) Heatmap of normalized counts (rlog transformed) of selected significant DE genes (adjusted p-value < .05, lfcSE ≤ 1.5, L2FC ≤ −1.3 and L2FC ≥ 1.3) for each condition clustered by gene. Each column represents a single animal (Saline, blue; Maintenance, red; Abstinence, green). Saline (n = 5), Maintenance (n = 5), Abstinence (n = 7).

