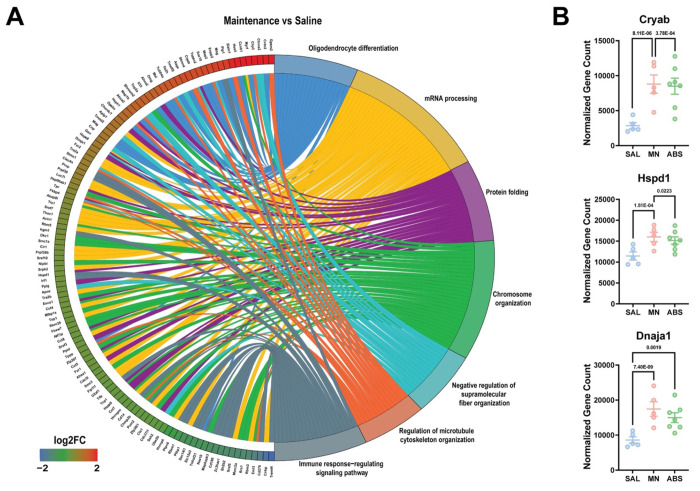
Figure 3. Gene Ontology (GO) enrichment analysis reveals dysregulation of protein folding and mRNA processing following METH self-administration.
A) Chord plot showing interaction between GO biological process terms and genes comparing Maintenance vs Saline. B) Normalized counts of significant DE genes with adjusted p-value for each comparison. Significance shown reflects pairwise comparison results from DESeq2. Saline (n = 5), Maintenance (n = 5), Abstinence (n = 7). Data are represented as mean ± SEM.

