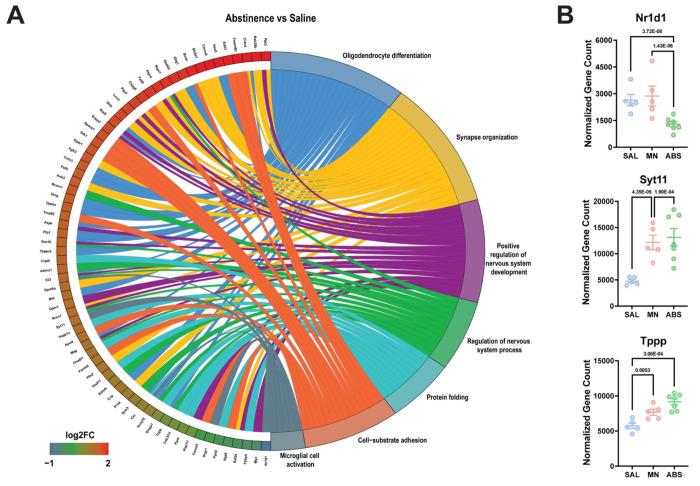
Figure 5. Gene Ontology (GO) enrichment analysis reveals persistent dysregulation of cell adhesion and microglial activation during abstinence.
A) Chord plot showing interaction between GO biological process terms and genes comparing Abstinence vs Saline, B) Normalized counts of significant DE genes with adjusted p-value for each comparison. Significance shown reflects pairwise comparison results from DESeq2. Saline (n = 5), Maintenance (n = 5), Abstinence (n = 7). Data are represented as mean ± SEM.

