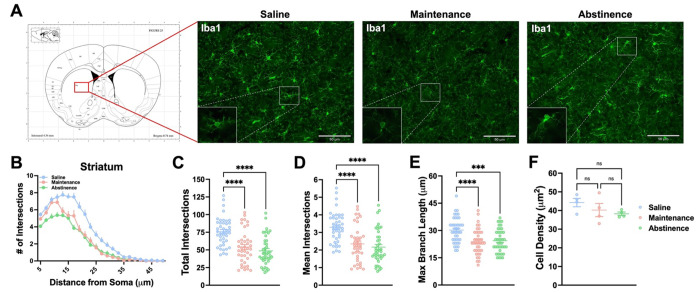
Figure 6. Dorsal striatal microglia exhibit persistent altered morphology following METH self-administration.
A) Representative fluorescent images (Bregma 0.7-0.8 mm, Paxinos and Franklin’s the Mouse Brain in Stereotaxic Coordinates) of microglia (Iba1+ cells) in the dorsal striatum. B) Sholl analysis plot of microglia. C-E) Mice that self-administered METH (Maintenance), as well as METH-abstinent mice (Abstinence), display less ramifications and branching complexity than Saline-taking mice (Saline) with no significant change in density. One-way ANOVA with Tukey post-hoc test (Between Conditions, **p < .01, ***p < .001, ****p < .0001). 40-43 cells per condition (n = 4 animals, 10-12 cells per animal). Data are represented as mean ± SEM. Scale bar = 90 μm.

