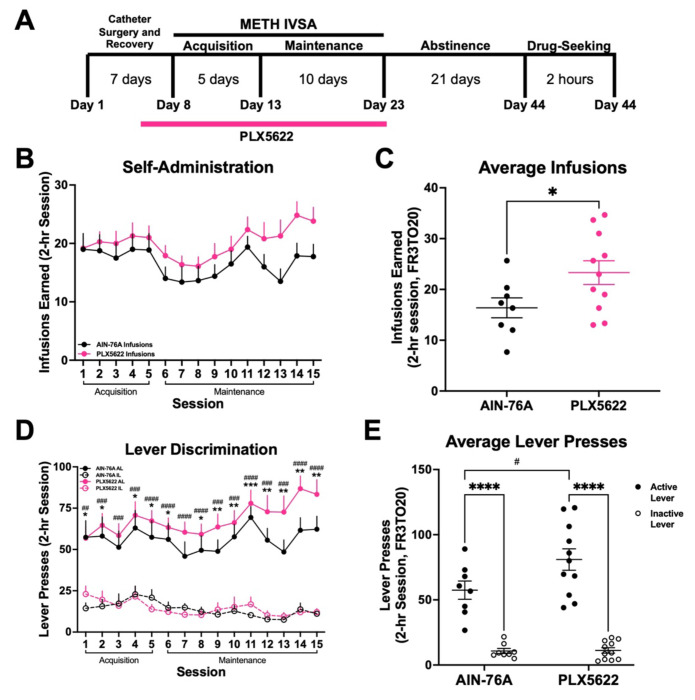
Figure 7. Microglial depletion increases METH self-administration.
A) Experimental timeline. B) METH intake and infusions earned during 15 daily 2-hr sessions (FR3TO20). C) Average infusions earned over the last 3 days of Maintenance. Unpaired t-test with Welch’s correction (AIN-76A vs PLX5622, *p < .05). D) Active and inactive lever presses during 15 daily 2-hour sessions (FR3TO20). Two-way RM ANOVA with Bonferroni’s post-hoc test, (AIN-76A Active vs Inactive Lever, *p < .05, **p < .01, ***p < .001; PLX5622 Active vs Inactive Lever, #p < .05, ##p .01, ###p < .001, ####p < .0001) E) Average active and inactive lever presses over the last 3 days of Maintenance. Two-way ANOVA with Bonferroni’s post-hoc test (Active vs Inactive Lever, ****p < .0001; AIN-76A Active vs PLX5622 Active, #p < .05). AIN-76A (n = 8), PLX5622 (n = 11). Data are represented as mean ± SEM.

