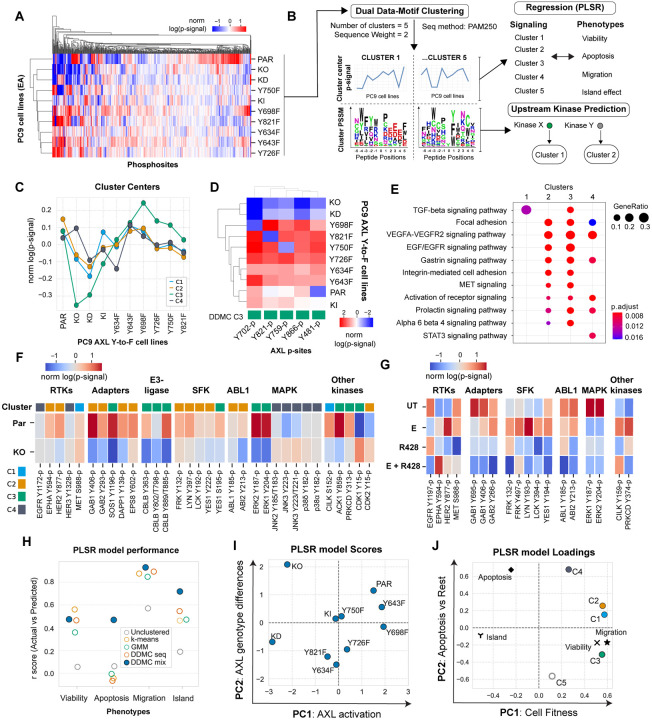
Figure 2. DDMC signaling clusters predict the AXL-mediated phenotypes and identifies CK2, Abl1, and SFK as putative bypass signaling drivers.
(A) Global phosphoproteomic measurements from each of the PC9 AXL Y-to-F cell lines. (B) Computational strategy to map the network-level phosphoproteomic changes driving AXL-mediated phenotypic responses. The signaling data was clustered using DDMC to generate 5 clusters of peptides displaying similar phosphorylation behavior and sequence features. The cluster centers were then fit to a PLSR model to predict the phenotypic responses and find associations between clusters and phenotypes. DDMC was used to infer putative upstream kinases regulating clusters. (C) Average relative phosphorylation signal of the DDMC cluster centers. (D) Phosphorylation signal of AXL phosphosites per PC9 cell line and their cluster assignments. (E) Ranked GSEA analysis of DDMC clusters using ClusterProfiler. Gene lists per cluster were ranked based on the log phosphorylation abundance fold change of PC9 parental versus AXL KO cells. (F) Selected phosphosites and their cluster assignments in PC9 parental and AXL KO cells (G) Selected phosphosites in PC9 parental cells treated with E, R428, or both. (H) PLSR model prediction performance using the 5 indicated clustering strategies: no clustering (directly fitting the phosphoproteomic data, 5 cluster centers generated by k-means, clusters from a Gaussian Mixture Model (GMM), DDMC using only the peptide sequence information, or DDMC equally prioritizing the sequence and phosphorylation information. (I-J) PSLR scores (I) and loadings (J).

