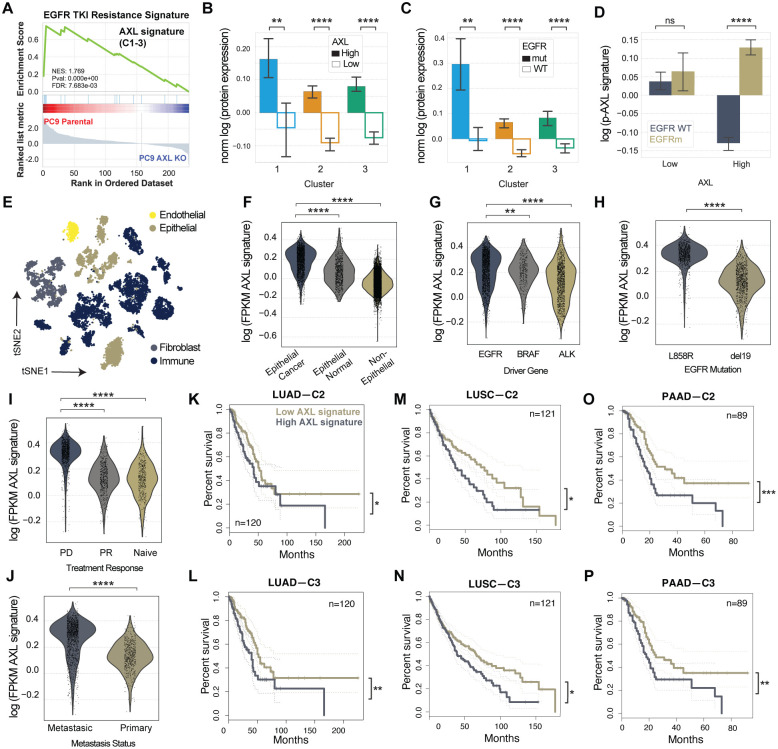
Figure 3. AXL downstream signature based on C2 and C3 is specific to AXL-high EGFRm LUAD tumors and correlates with progressive disease.
(A) EGFR TKI resistance signature found by a ranked GSEA analysis using the list of gene names included in C1, C2, and C3 and ranked by their log fold-change phosphorylation between PC9 parental and AXL KO cells. (B–C) Protein expression of C1, C2, and C3 members in (B) AXL-low versus AXL-high tumors or (C) EGFRm versus EGFR WT tumors. (D) Phosphorylation signal of AXL downstream signature by AXL levels and EGFR genotype. (E) tSNE plot of the different cell types of LUAD patient samples defined by Louvain clustering. (F) AXL signature score as defined by the mean gene expression of C1, C2, and C3 per cell in cancer cells, epithelial normal cells, or nonepithelial cells. (G–J) AXL signaling score of cancer cells by (G) driver mutation, (H) EGFR mutation, (I) treatment response or (J) metastatic status. (K–P) Kaplan-Meier curve of (K–L) LUAD, LUSC (M–N), and PAAD (O–P) patients according low or high C2 or C3 gene expression. PD: Progressive disease, PR: Partial Response. PAAD: Pancreatic adenocarcinoma. Error bars in (B-D) show the standard error of the mean. Statistical significance was calculated by Mann-Whitney U rank tests in (B-J) and by logrank tests in (K-P). *p-value < 0.05, **p-value < 0.001, ***p-value < 0.0001, ****p-value < 0.00001, ns means not significant.

