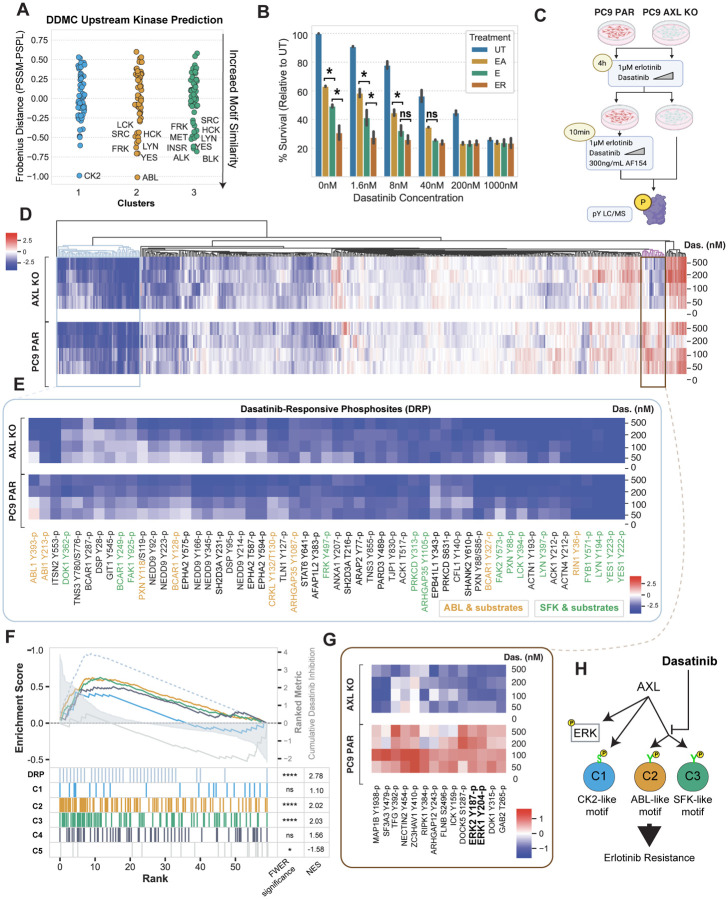
Figure 4. Dasatinib inhibits C2 and C3.
(A) DDMC upstream kinase predictions. (B) Cell confluency of PC9 parental cells exposed to the indicated treatments with increasing concentrations of dasatinib for 72 hours. Data normalized to untreated cells. Statistical significance was calculated by Student’s t-tests. (C) Diagram of the MS experiment. Cells were treated with E and the indicated concentration of dasatinib for 4 hours and subsequently with AF154 for 10 minutes. Cells were then lysed and subjected to mass spectrometry (see Methods). (D) Hierarchical clustering of the entire phosphoproteomics data set of PC9 PAR and AXL KO cells showing the log phosphorylation signal of peptides normalized to the 0 nM dasatinib condition per cell line. (E) Heatmap of dasatinib-responsive phosphosites (DRP). Abl1 and SFK substrates were manually annotated according to PhosphoSitePlus. (F) Ranked GSEA of DRP and DDMC clusters. Peptides were ranked by calculating the cumulative inhibition across increasing dasatinib concentrations. (G) Cluster of phosphosites showing an increased signal in PC9 PAR but decreased phosphorylation in AXL KO cells treated with the indicated concentrations of dasatinib and EA. (I) Cartoon illustrating the effect of dasatinib on AXL downstream signaling. In B and F, *p-value < 0.05, ****p-value < 0.00001, ns means not significant.

