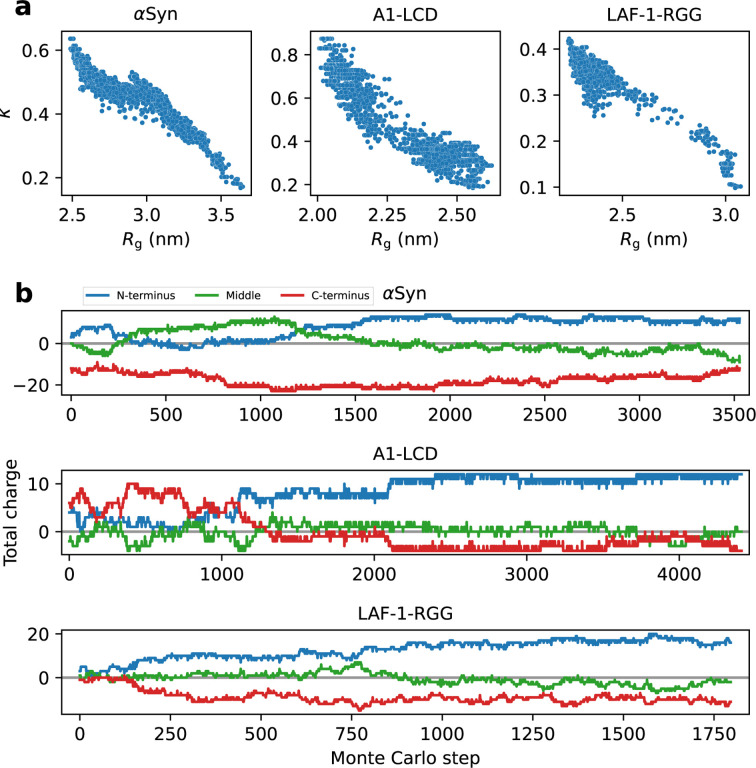
Figure 3.
(a) Correlation between Rg and k (a high k indicates segregated clusters of residues with the same charge, a low k indicates that charges are well mixed along the sequence). (b) We divided the sequences of αSyn, A1-LCD and LAF-1-RGG into three sections covering the N-terminal third (blue), the middle third (green), and the C-terminal third (red) of the sequence, and calculated the total charge in each of these sections.

