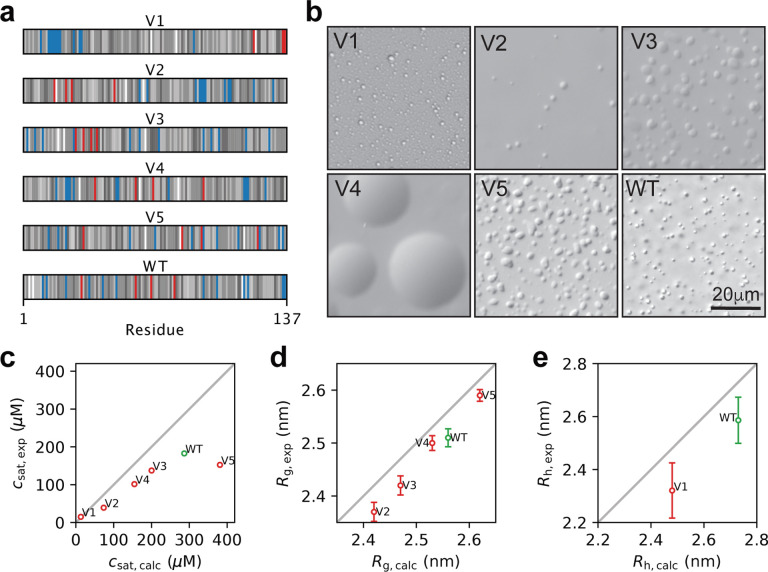
Figure 5.
Experimental characterization of wild-type A1-LCD and five designed variants. (a) Diagram of the arrangement of amino acids in A1-LCD and the five design variants. Negative and positive charges are coloured respectively in red and blue. The neutral residues are coloured by a grey scale that reflects their hydrophobicity (corresponding to the λ parameter in CALVADOS), with the least hydrophobic residues in white and the most hydrophobic residues in black. (b) Visualization of condensates of wild-type A1-LCD and the five variants by DIC microscopy; these images are only meant to illustrate the formation of condensates and not necessarily differences between the variants. (c) Comparison of experimental and calculated values of csat at 298 K. (d) Comparison of experimental and calculated values of Rg for wild-type A1-LCD and V2–V5. (e) Comparison of experimental and calculated values of Rh at 304 K for wild-type A1-LCD and V1. Error bars whose sizes are comparable to that of the markers are not shown.

