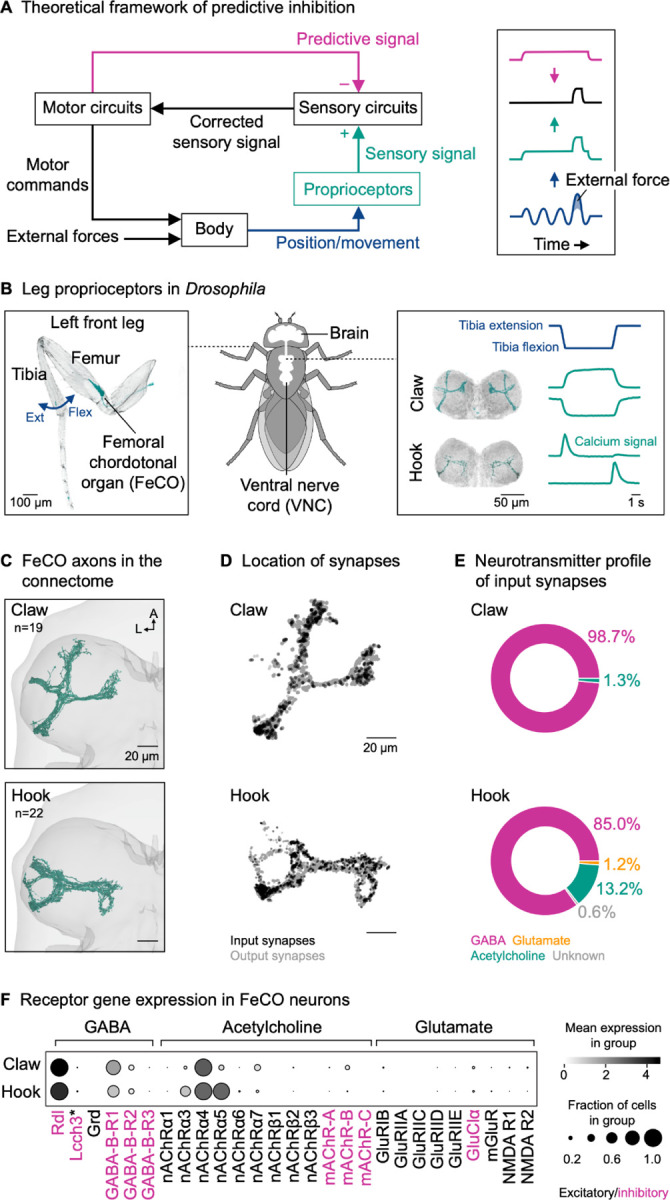
Figure 1. Proprioceptor axons from the Drosophila leg are positioned to receive presynaptic inhibition.

(A) Left: Theoretical framework for predictive inhibition of proprioceptive pathways. Motor circuits send a predictive inhibitory signal (magenta) based on the motor commands to the sensory circuits. The predictive signal is subtracted from the measured sensory signal (green), representing a joint angle (blue) resulting from self-generated motor commands and external forces. The corrected sensory signal (black) can be used to counteract external forces without impeding voluntary movement. Right: Schematic time courses illustrating a situation where the predictive signal matches the sensory signal in timing and amplitude.
(B) Left: Confocal image of a Drosophila front leg showing the location of the femoral chordotonal organ (FeCO) cell bodies and dendrites. Green: GFP; gray: cuticle auto-fluorescence. The blue arrow indicates the extension (Ext) and flexion (Flex) of the tibia relative to the femur. Right: Confocal image of position-encoding claw and movement-encoding hook axons in the fly ventral nerve cord (VNC). Flexion- and extension-encoding hook axons are overlaid. Green: GFP; gray: neuropil stain (nc82). Schematized calcium signals from claw and hook axons (GCaMP, green) in response to a controlled, passive movement of the femur-tibia joint (blue) based on Mamiya et al.19.
(C) Top view of reconstructed claw and hook axons in the left front leg neuromere of the FANC connectome. n: number of axons; A: anterior; L: lateral.
(D) Location of input and output synapses of all reconstructed claw and hook axons. View as in (C).
(E) Neurotransmitter profile of the input synapses of claw and hook axons.
(F) Expression levels of receptor genes in claw and hook neurons. Black intensity represents the mean level of gene expression in a cluster relative to the level in other clusters. Dot size represents the percent of cells in which gene expression was detected. Asterisk indicates that Lcch3 forms inhibitory channels with Rdl and excitatory channels with Grd24.
See also Video S1.
