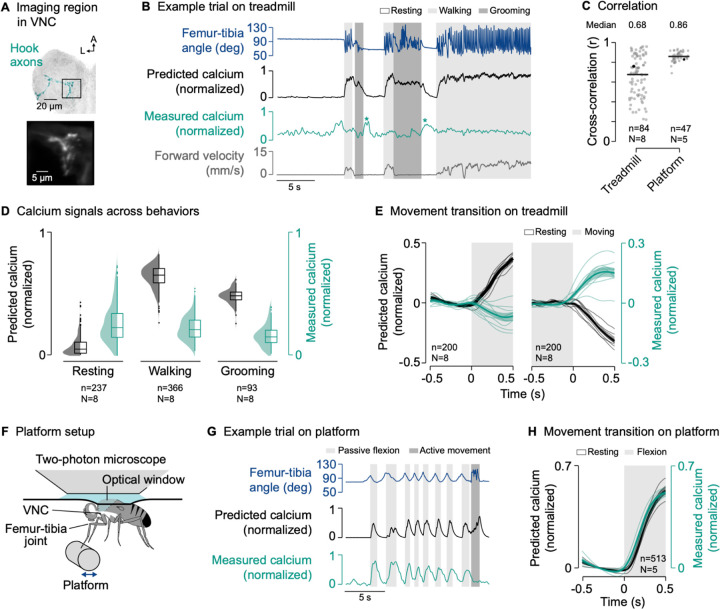
Figure 3. The axons of movement-encoding proprioceptors are suppressed during active leg movements.
(A) Top: Confocal image of movement-encoding hook (flexion) axons in the VNC. The black box indicates the imaging region. Green: GFP; gray: neuropil stain (nc82). A: anterior; L: lateral. Bottom: Mean tdTomato signal within the imaging region during an example trial.
(B) Example trial of two-photon calcium imaging of hook flexion axons in the neuromere of the left front leg and behavior tracking on the treadmill. The asterisks highlight resting bouts during which the front leg was held in the air and slowly flexed, likely as a result of passive forces produced by leg muscles and skeletal structures.
(C) Cross-correlation coefficient between predicted and measured calcium signals per trial at a time lag of zero in different movement contexts. Black lines show medians. Black dots mark the trials shown in (B) and (G). In platform trials, active movements were excluded for the cross-correlation. n: number of trials; N: number of flies.
(D) Median predicted and measured calcium signals during resting, walking, and grooming. Bouts are ≥1 s in duration. Distributions show kernel density estimations. n: number of behavioral bouts; N: number of flies.
(E) Predicted and measured calcium signals aligned to the transitions into and out of movement. Signals are baseline subtracted (mean from −0.5 to 0 s). Movement includes walking and grooming. Thin lines show animal means, thick lines show mean of means, shadings show standard error of the mean. n: number of transitions; N: number of flies.
(F) Experimental setup for passively moving the left front leg via a platform during two-photon calcium imaging from the VNC.
(G) Example trial of two-photon calcium imaging of hook flexion axons and behavior tracking on the platform.
(H) Predicted and measured calcium signals aligned to the transition into passive flexion of the femur-tibia joint. Lines and labels as in (E).
See also Figures S1 and S3 and S4 and S5 and S6 and Video S3.

