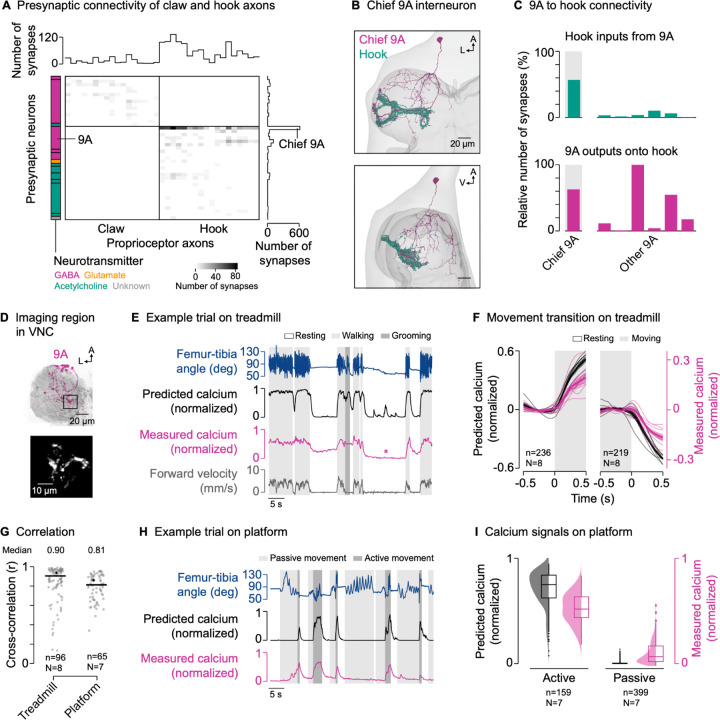
Figure 4. GABAergic interneurons provide presynaptic inhibition to movement-encoding proprioceptor axons.
(A) Connectivity of presynaptic neurons with claw and hook axons. The grayscale heatmap indicates the number of synapses between neurons (connection strength). Boxes on the left group presynaptic neurons of the same developmental lineage, with the color indicating their primary fast-acting neurotransmitter. Boxes from top to bottom: 13B and 19A (both GABA); 3A (acetylcholine); 9A, 13B, and 19A (all GABA); 8A (glutamate); 1A, 8B, 18B, 22A, hook axons, and hair plate axon (all acetylcholine); unknown.
(B) Top and side view of the chief GABAergic 9A neuron presynaptic to hook axons in the left front leg neuromere in FANC. A: anterior; L: lateral; V: ventral.
(C) Connectivity between 9A neurons and hook axons.
(D) Top: Confocal image of 9A neurons in the VNC. The black box indicates the imaging region. Magenta: GFP; gray: neuropil stain (nc82). A: anterior; L: lateral. Bottom: Mean tdTomato signal within the imaging region during an example trial.
(E) Example trial of two-photon calcium imaging of 9A neurons in the neuromere of the left front leg and behavior tracking on the treadmill. The asterisk highlights a resting bout during which the front leg was moved passively by the grooming hind legs.
(F) Predicted and measured calcium signals aligned to the transitions into and out of movement. Movement includes walking and grooming. Thin lines show animal means, thick lines show mean of means, shadings show standard error of the mean. n: number of transitions; N: number of flies.
(G) Cross-correlation coefficient between predicted and measured calcium signals per trial at a time lag of zero in different movement contexts. Black lines show medians. Black dots mark the trials shown in (E) and (H). n: number of trials; N: number of flies.
(H) Example trial of two-photon calcium imaging of 9A neurons and behavior tracking on the platform.
(I) Median predicted and measured calcium signals during active and passive movement bouts on the platform. Bouts are ≥1 s in duration. Distributions show kernel density estimations. n: number of movement bouts; N: number of flies.

