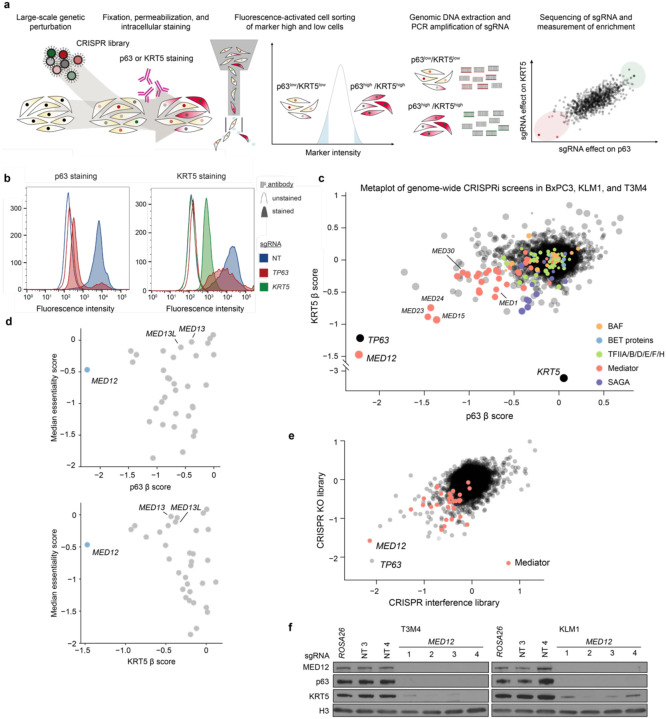
Fig. 1. Intracellular FACS-based genome-wide CRISPR screens uncover MED12 as a critical regulator of basal lineage identity in PDAC.
a, Diagram illustrating the workflow of KRT5 or p63 genome-wide reporter screens. b, Flow cytometry staining profiles for CRISPRi-mediated TP63 or KRT5 knockdown in KLM1 cells. Secondary staining with AF647-conjugated anti-rabbit antibody (area-filled curves) or unstained controls (outline-only curves) show the signal distribution of p63- (left) or KRT5- (right) stained cells upon gene knockdown. A minimum of 10,000 events were collected and plotted for each sample. c, Metaplot of p63- and KRT5-based reporter genome-wide CRISPRi screen results in 3 independent cell lines (KLM1, T3M4 and BxPC3). Average β scores of p63 and KRT5 screens are plotted such that each dot represents one promoter-defined gene. The size of each dot is proportional to the inverse of the standard deviation of the β values across cell lines. Important mammalian general transcriptional regulators are highlighted according to the legend. β scores were calculated using MAGeCK with the MLE option, with negative β scores denoting enrichment in the markerlow population. d, Scatterplot of the average β scores in the p63 (top) or KRT5 (bottom) reporter screens across KLM1, T3M4, and BxPC3, and the median CERES cancer cell line essentiality score from the Cancer Dependency Map. e, Scatterplot of p63-based reporter screens β scores using genome-wide CRISPRi or CRISPR knockout libraries in KLM1 cells. Genes belonging to the Mediator complex are highlighted in red. f, Western blot of whole cell lysates at day 6 post-infection with lentiviral CRISPR knockout sgRNA targeting MED12 or negative control sgRNAs in T3M4 and KLM1 cells.

