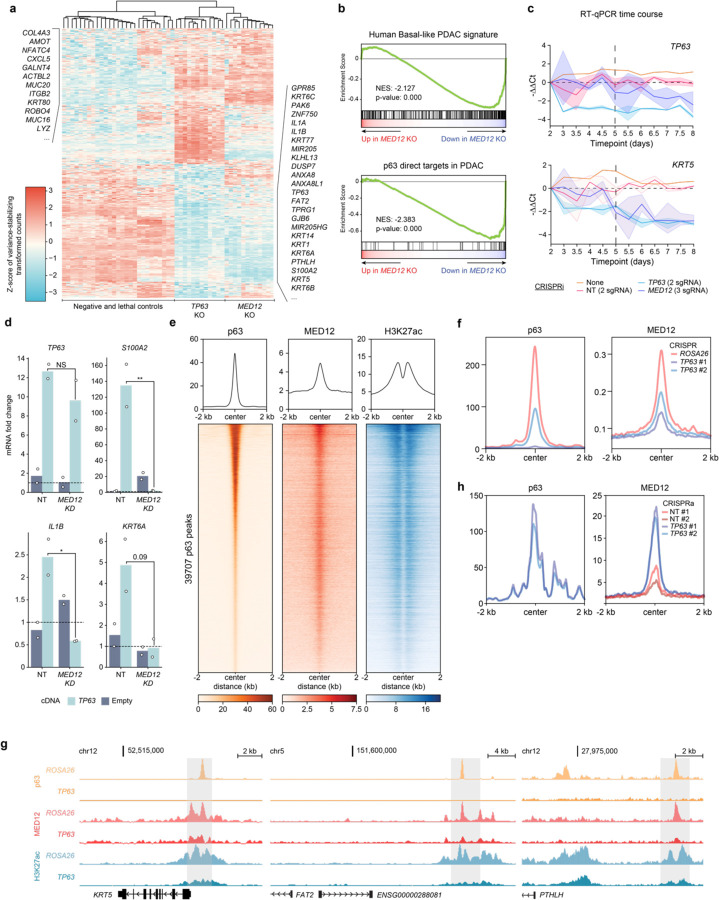
Fig. 2. p63 recruits MED12 to chromatin to coactivate the basal transcriptional signature.
a, Heatmap of z-scored variance-stabilizing transformed gene counts of top 250 overexpressed and downregulated genes upon TP63 knockout in T3M4 cells. Non-targeting sgRNAs or knockout of ROSA26 (negative controls); CDK1, PCNA, or RPA3 (lethal controls); TP63; or MED12 were performed with two to four different sgRNAs and three biological replicates each. Each column corresponds to an individual RNA-seq sample, and each row displays the z-score of variance-stabilized transformed counts (calculated with DESeq2) across samples. Samples are clustered by Euclidean distance according to the dendrogram on top of the figure. Genes associated with basal (right) and classical (left) PDAC are labeled on the side. b, Representative GSEA plots of T3M4 MED12 knockout using gene signatures derived from human basal PDAC tumors (Chan-Seng-Yue et al. 2020) and direct p63 gene targets in PDAC (Somerville et al. 2018). The plots were generated and the normalized enrichment scores (NES) and statistics were calculated using DESeq2-derived log2FC values of MED12 vs ROSA26 KO in GSEApy. Three biological replicates were used for each sample. Complete GSEA analysis for all the sgRNA tested can be found in Supplementary Table 2. c, Time-course RT-qPCR of TP63 and its target gene KRT5 after lentiviral infection with CRISPRi sgRNA targeting TP63 (2 sgRNA), MED12 (3 sgRNA), non-targeting sgRNAs (2 sgRNA), or uninfected control T3M4 cells. −ΔΔCt values are plotted as the average of each sgRNA normalized to the average of housekeeping genes ACTB and B2M. For each gene perturbation, the average −ΔΔCt value is shown in a solid line, and the 95% confidence intervals are shown as translucid intervals. MED12 knockdown inflection point (~ day 5) is marked by a vertical black dashed line. d, RT-qPCR of TP63 and its target genes S100A2, IL1B and KRT6A after TP63 or empty vector cDNA overexpression and MED12 (2 sgRNA) or non-targeting (2 sgRNA) CRISPRi sgRNAs. RNA was collected at day 5.5 post-infection with lentiviral sgRNAs, and three days after cDNA overexpression. mRNA fold change values are calculated as 2−ΔΔCt normalized to the average of housekeeping genes ACTB, B2M and PPIA. *: double-sided t-test p-value<0.05. e, Metaplots and heatmaps of p63, MED12, and H3K27ac chromatin occupancy in KLM1 cells. Signal intensity values are centered around p63 peaks annotated by MACS2 and sorted by p63 intensity. f, Metaplots of p63 (left) and MED12 (right) genome occupancy signals centered around MED12 peaks at basal enhancers in KLM1 cells upon ROSA26 or TP63 knockout (2 sgRNA). g, ChIP-seq tracks of p63, MED12, and H3K27ac normalized occupancy at select basal-specific p63 direct target loci in KLM1 cells upon ROSA26 or TP63 knockout. Normalized enrichment values were generated with DeepTools bamCoverage -RPCG. h, Metaplots of p63 (left) and MED12 (right) genome occupancy signals centered around MED12-occupied peaks surrounding p63 direct target genes in SUIT2 CRISPRa-TP63 lines. e,f,h, Metaplots and heatmaps were generated using DeepTools computeMatrix and plotHeatmap.

