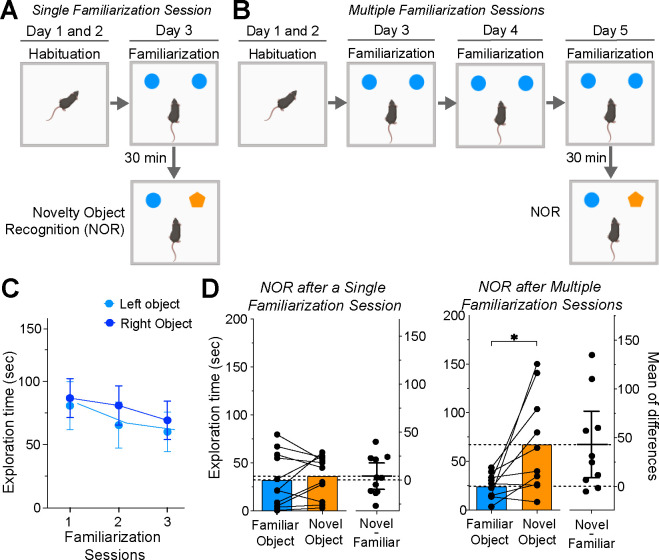
Figure 1. Impact of Familiarization Session Number on Novelty Object Recognition.
(a) Single familiarization session NOR protocol schematic. (b) Multiple familiarization sessions NOR protocol schematic. (c) Graph of exploration time for two identical objects over three sessions, showing a minor decline (ANOVA, main effect of sessions, P = 0.0471). (d) Time exploring familiar and novel objects during NOR for groups exposed to single (left graph, n=11) and multiple (right graph, n=10) familiarization sessions; significant difference in exploration in multiple familiarization group (*P = 0.0098). The graphs’ right side represents the estimation plots showing mean differences (dots) and respective 95% confidence intervals.

