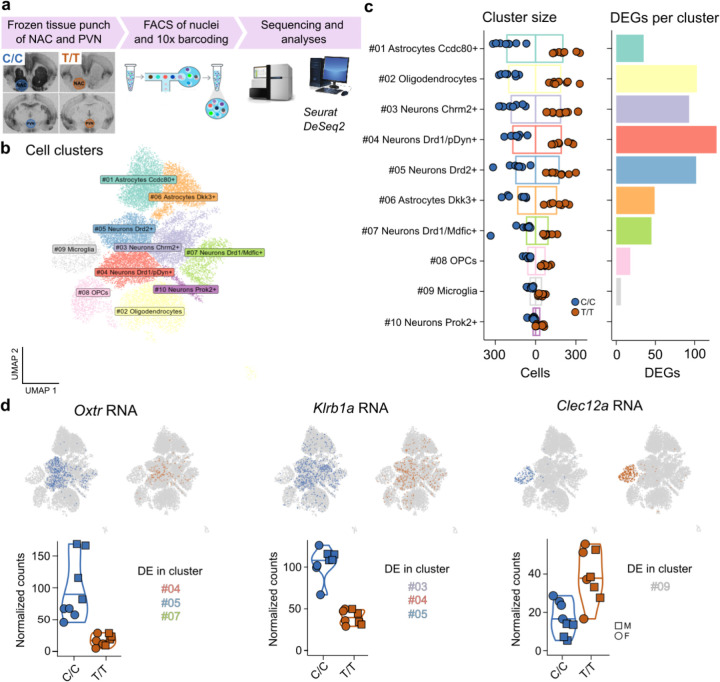
Figure 3. Non-coding genetic variation in the Oxtr gene associates with gene expression differences across cell types.
a) Schematic of experimental workflow. b) Annotated cell clusters. c) (Left) Size of cell clusters, split by genotype. (Right) Number of DEGs per cell cluster. OPCs are oligodendrocyte precursor cells d) Examples of three DEGs: Oxtr (Left), Klrb1a (Middle), and Clec12a (Right) that illustrate genotype effects on gene expression in a cell-type dependent manner. UMAP plots depict RNA expression with cellular resolution, violin plots show bulk expression levels. Indicated are the cell clusters in which genes were DE.

