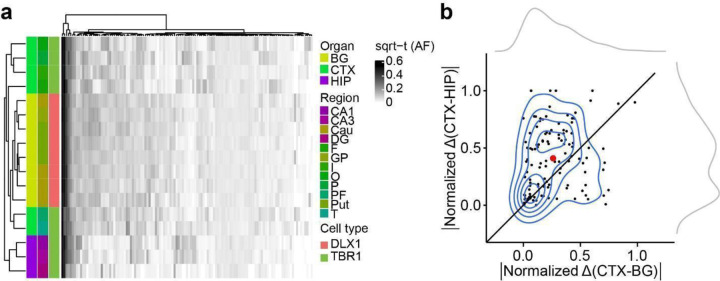
Extended Data Fig. 6. Evidence for HIP lineage restriction occurring prior to CTX or BG in ID01 sorted nuclear pools.
(a) Heatmap with 17 sorted nuclear samples based on sqrt-t AFs of 121 informative MVs from ID01, similar to Fig. 2c, showing greater HIP lineage separation compared with CTX or BG (purple compared with green or yellow). (b) Contour plot (at center) with 121 informative MVs derived from (a) and two kernel density estimation plots (at periphery). Axes show the absolute normalized difference value for each MV between the average AF of CTX and BG (CTX-BG) or CTX and HIP regions (CTX-HIP). Solid line: identity. Red dot: averaged x and y values of individual data points. sqrt-t AF, square-root transformed allele fraction; CTX, cortex; BG, basal ganglia; HIP, hippocampus; Cau, caudate; DG, dentate gyrus; HIP and Hip, hippocampal tissue; I, insular cortex; O, occipital cortex; P, parietal cortex; PF, prefrontal cortex; Put, putamen; T, temporal cortex; GP, globus pallidus.

