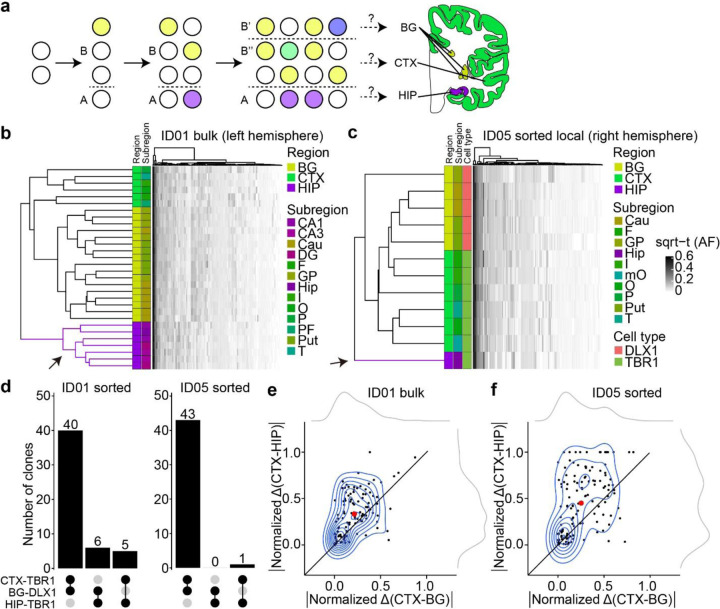
Figure 2. Human hippocampal lineage diverges from the cortex and basal ganglia.
(a) Model of clonal dynamics in forebrain anlage. Cells restricted to anlage A, which acquire a new MV (purple) are rarely present in anlage B. Later, B diverges into B’ and B”, which share more clones (yellow) than with anlage A. This analysis was applied to the geographies of the basal ganglia (BG), cortex (CTX) and hippocampus (HIP). (b–c) Heatmaps with 30 bulk samples from left hemispheric CTX, BG, and HIP (y-axis, b) or 12 selected sorted cell types (y-axis, c), compared with MVs identified in at least two samples (146 MVs, x-axis in (b) or 131 MVs, x-axis in (c)), depicted in Fig. 2d. Dendrograms at right shows greater HIP lineage separation (purple, arrow) compared with CTX or BG (green and yellow) either using bulk tissue (b) sorted nuclei (c), suggesting HIP earlier lineage restriction. (d) Counts of shared MVs across CTX, BG or HIP within sorted nuclear pools showing many more shared MVs between CTX and BG compared with HIP in both donors ID01 and ID05. (permutation p-value <0.001) (e–f) Contour plots of informative 113 and 131 MVs from (b) and (c) (blue) and two kernel density estimation plots (grey). Axes show absolute normalized AF difference for each MV averaged across all samples from the respective tissues (CTX, HIP, BG). Black line: identity line, black dots: individual MVs, large red dot: averaged across all MVs, suggesting AF differences are smaller between CTX and BG than between CTX and HIP. Abbreviations: Cau, caudate; DG, dentate gyrus; HIP and Hip, hippocampal tissue, where lowercase Hip refers to hippocampal subregion not specified; I, insular cortex; O, occipital cortex; P, parietal cortex; PF, prefrontal cortex; Put, putamen; T, temporal cortex; mO, medial occipital cortex; GP, globus pallidus; sqrt-t (AF), square-root transformed allele fraction.

