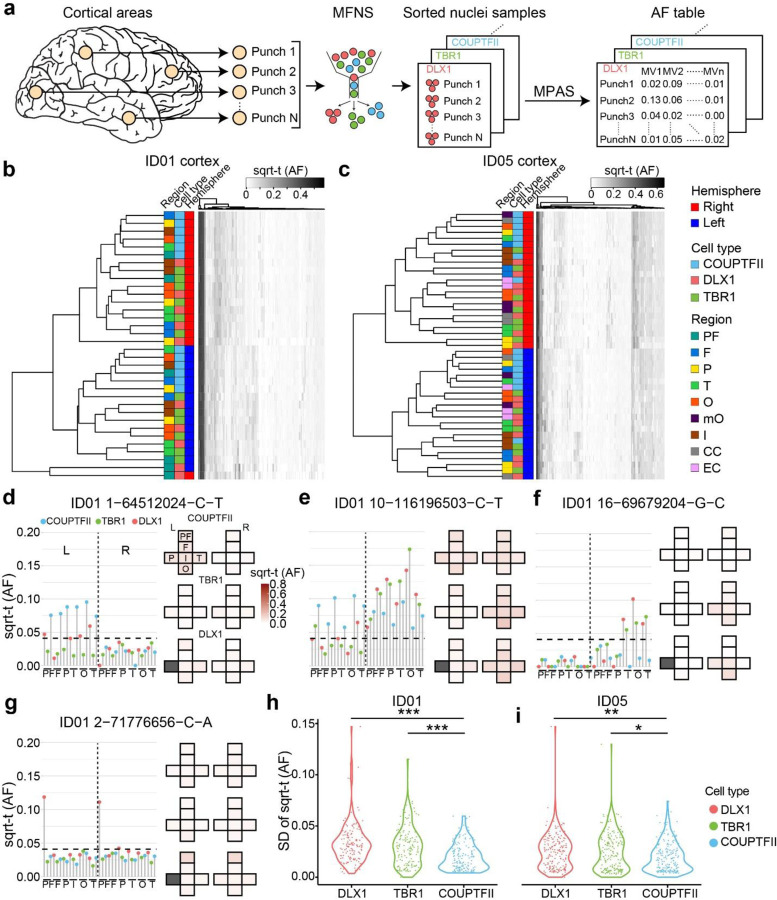
Figure 3. Cell-type-resolved clonal dynamics of cortical excitatory and inhibitory neurons.
(a) cMVBA workflow uses MFNS nuclei for MPAS assessment of AFs in cortical punches. (b–c) Heatmaps of sorted nuclei based on AFs of 146 informative shared MVs from ID01 (b) and 186 from ID05 (c) (y-axis) compared with color-coded hemisphere, cell type or region. PF, prefrontal cortex; F, frontal cortex; P, parietal cortex; T, temporal cortex; O, occipital cortex; mO, medial occipital cortex; I, insular cortex; CC, cingulate cortex; EC, Entorhinal cortex. sqrt-t (AF), square-root transformed allelic fraction. Dendrograms indicate that subcortically derived COUTFII samples cluster together (teal), whereas DLX1 and TBR1 samples derived from the same region cluster together (notice interspersed orange and green boxes) suggesting shared lineage relationships. (d–g) Lolliplots comparing regions (x-axis) with sqrt-t AF (y-axis) for representative MVs. Height of individual lollipop: AF; color: cell type; dashed line: threshold. Next to each lolliplots is the ‘geoclone’ representation of sqrt-t AF shaded intensity (pink) from tissue where detected. Gray boxes: not sampled. (d) MV at chr. 1 position 64512024 C-T is found in COUPTFII+ cells in the left hemisphere at AFs different from either DLX1+ or TBR1+ cells, consistent with COUPTFII+ cells having different lineage than DLX+ or TBR1+. MVs in (e–f) also show more AF similarities between DLX+ or TBR1+ than COUPTFII+ cells. MF in (g) shows a representation of DLX1+ cells in both prefrontal lobes, consistent with a potential ventrally-derived DLX1+ clone distributed across the two hemispheres. (h–i) Standard deviation (SD) of sqrt-t AFs for 146 and 186 MVs in the three different cell types in donor ID01 (h) and ID05 (i), respectively, showing lower variation in COUPTFII+ cells compared with DLX1+ or TBR1+, consistent with their clonal distribution across cortical areas. Each dot: single MV measured in 34 vs. 45 punches across the neocortex in ID01 and ID05, respectively. One-way ANOVA with Tukey’s multiple comparison test. *:P<0.05, **:P<0.001, ***P<0.0001. PF, prefrontal cortex; F, frontal cortex; P, parietal cortex; O, occipital cortex; T, temporal cortex; I, insular cortex; CC, cingulate cortex; mOC, medial occipital cortex; L, left; R, right.

