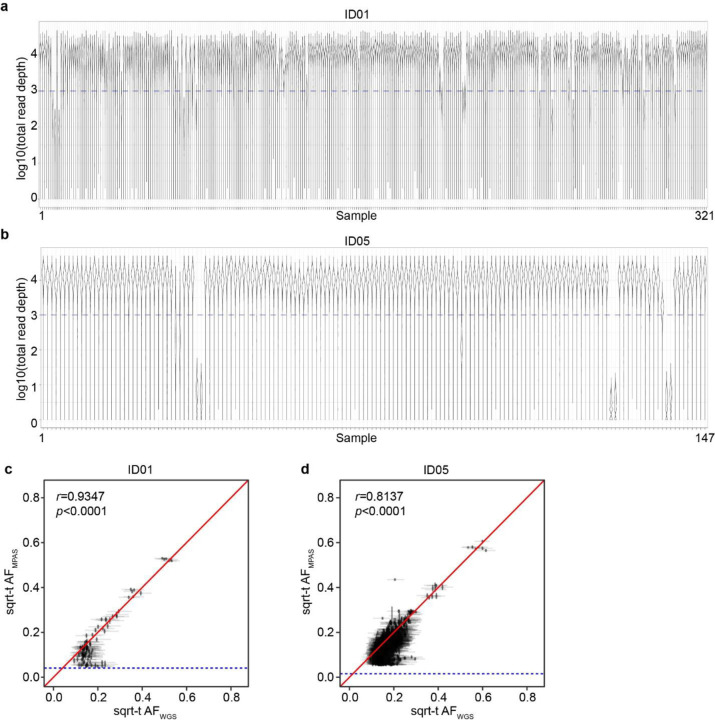
Extended Data Fig. 3. Quality controls of MPAS results.
(a–b) Violin plot distribution of log-transformed total read depths (y-axes) of individual variant positions in 321 or 147 samples from ID01 or ID05 (x-axes), respectively. (c–d) Correlation between sqrt-t AF of individual variants from WGS and MPAS. Blue horizontal dashed lines: Lower bound for binomial distribution detection threshold. r and p-values from Pearson’s Product-Moment correlation. Identity lines (red).

